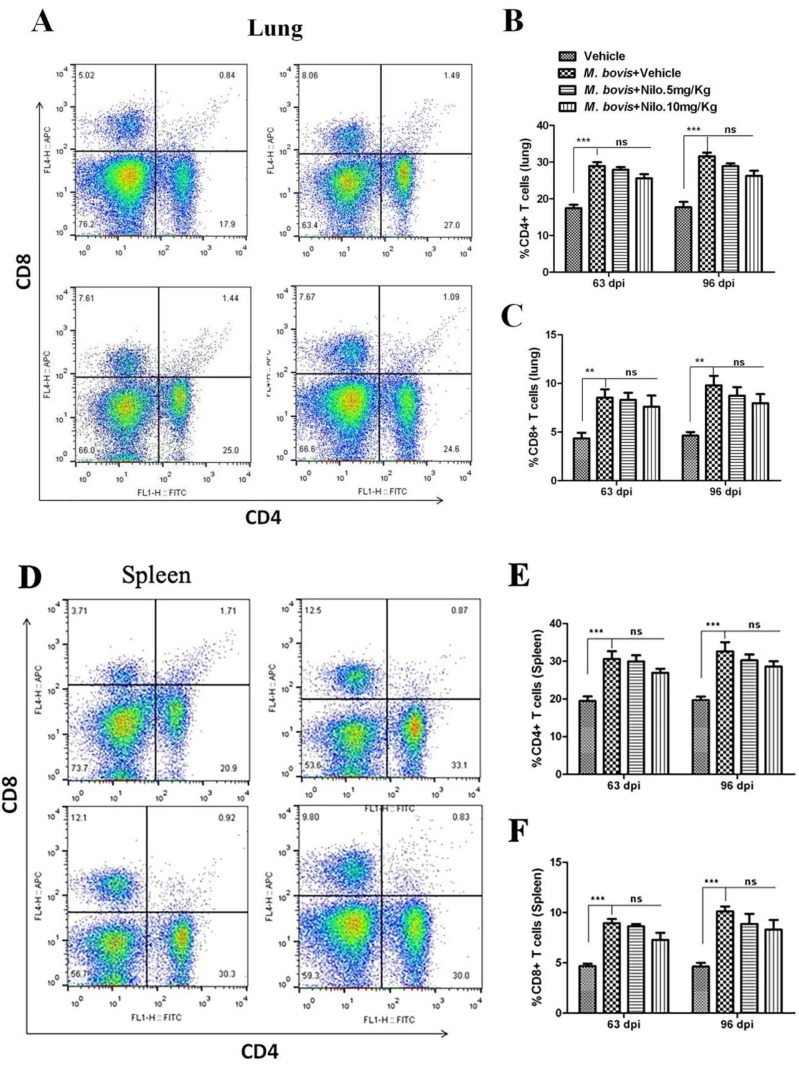
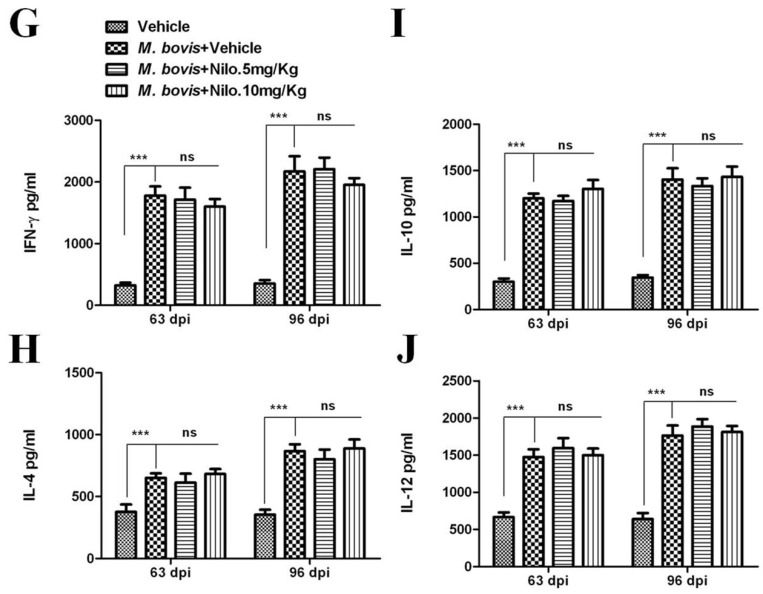
Figure 7.
The effect of nilotinib on T cells activation in mice infected with M. bovis. Lung and spleen tissues were collected at different time points from M. bovis infected and uninfected mice that were injected with the vehicle, nilotinib 5 mg/kg and 10 mg/kg (n = 3). (A) Representative flow cytometry plots and summary graph of the lung, (B) CD4+ and (C) CD8+ T-cells after ESAT-6 re-stimulation for 12–18 h. (D) Representative flow cytometry plots and summary graph of spleen, (E) CD4+ and (F) CD8+ T-cells after ESAT-6 re-stimulation for 12–18 h. CD4+ and CD8+ T cells population shown have pre-gated on CD3. (G–J) Blood serum samples were collected from uninfected, infected with M. bovis, and treated or untreated mice (n = 6). Serum samples were assayed for (G) IFN-γ, (H) IL-4, (I) IL-10, and (J) IL-12 by the ELISA technique. Statistical significance was determined by using two-way ANOVA followed by Bonferroni’s multiple comparisons. (** p < 0.01, *** p < 0.001).


