Figure 7.
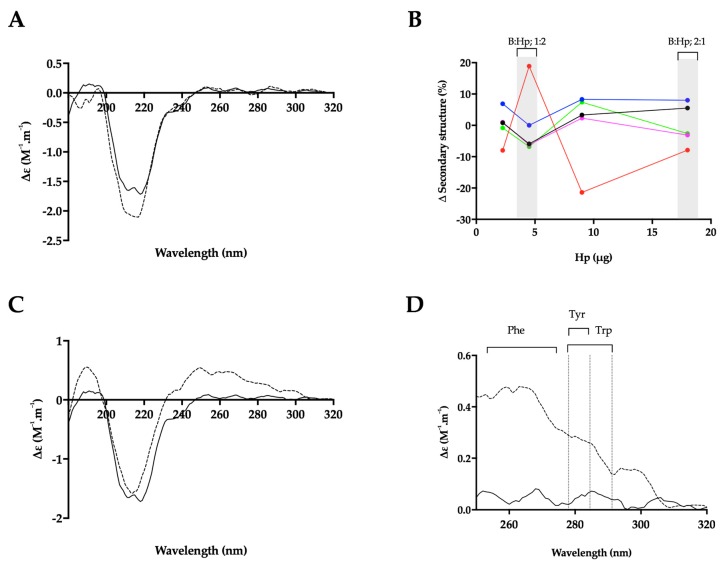
The structural change of BACE1 observed in the presence of Hp by circular dichroism (CD) spectroscopy. (A) CD spectra of BACE1 alone (solid line) or with Hp at a ratio of 1:2 (w/w; dashed line; B:Hp 1:2); (B) Δ secondary structure (%) of BACE1 upon the addition of increasing amounts of Hp; α-helix (black), antiparallel (red), parallel (blue), turn (magenta) and others (green) [48]. % structural change of B:Hp; 1:2 or 2:1 (w/w) ratio are highlighted in grey. (C) CD spectra of BACE1 alone (solid line) with Hp (dashed line) at a ratio of 2:1 w/w (D) Near-UV CD spectra of (C); respective absorption regions of aromatic amino acids are indicated [49]. Spectra were recorded in 50 mM sodium acetate buffer at pH 4.0 in all panels.

