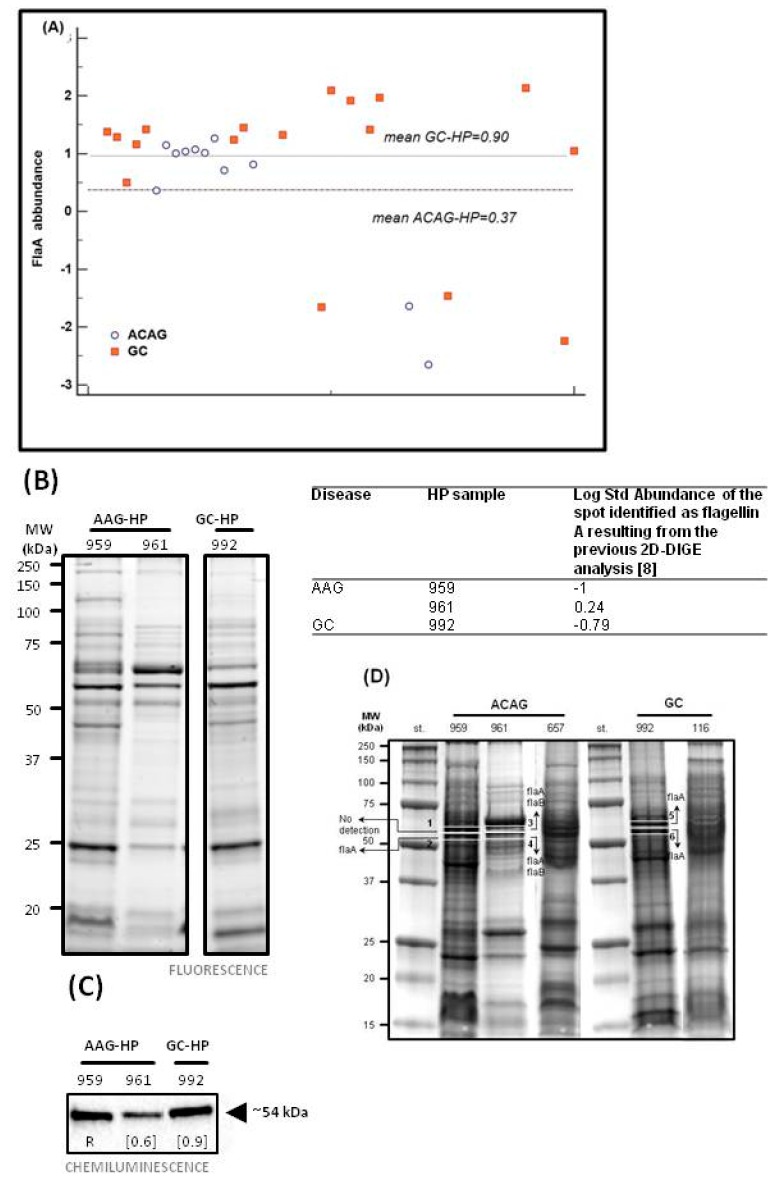
Figure 2.
Proteomic characterization of flagellin A. (A) Abundance of flagellin A spot in a validation set of H. pylori isolates of 11 AAG patients compared to isolates of 18 GC. The mean value of flagellin A abundance was lower (0.37) in H. pylori isolates from ACAG than those previously obtained in a set of H. pylori isolates from GC patients (0.90) [6]. (B) One dimensional electrophoresis (1DE) strain-free gel acquired upon excitation with the Chemidoc system before its transfer to nitrocellulose membrane and (C) immunoblotting validation of flagellin expression in H. pylori isolated from either AAG (samples 959 and 961) and one GC (sample 992). Chemiluminescence signals of proteins cross-reacted with the anti-flagellin antibody were detected at around 54 kDa. Numbers refer to the relative quantity of the band calculated with the Image Lab TM software (R, reference band for which quantity is 1). Table report the details of protein abundance (Log Std Abundance) related to a two-dimensional electrophoresis (2D) spot previously identified as flagellin A in the 3 samples analysed [6]. (D) One dimensional electrophoresis (1DE) and identification of flagellins A (flaA) and B (flaB) in H. pylori isolated from either ACAG and GC. Two portions in the ~50–60 kDa area of the blue-stained 1DE gel were excised from each sample (AAG-HP: 959 and 961; GC-HP: 992) and submitted to analysis by mass spectrometry for protein identification. Arrows in the gel portions indicate the presence of flaA in all the samples and flaB in the only 961 one.

