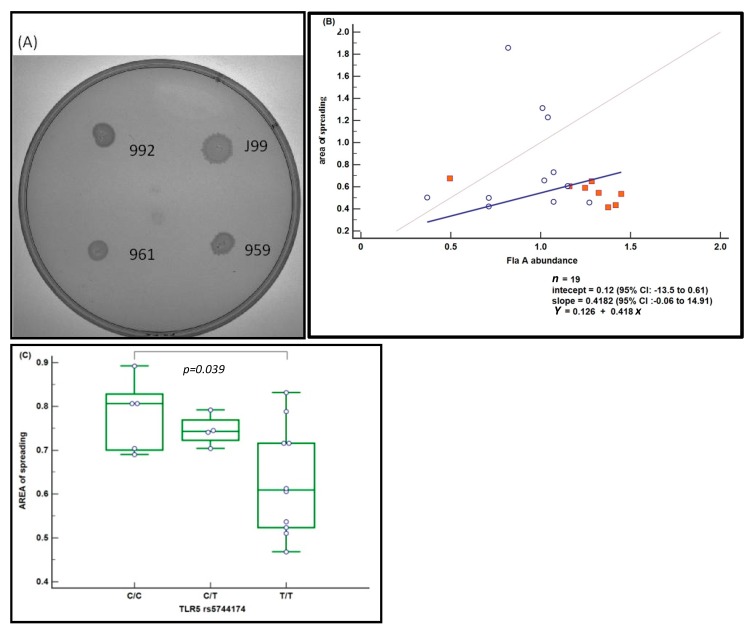
Figure 4.
Motility of H. pylori (A) Bacteria were plated in soft agar and photographed after incubation for 7 days at the same multiplicity. Control: HPJ99, motile H. pylori strain J99 (ATCC700824) from patient with duodenal ulcer (B) Passing badlock regression plots for area of spreading surrounding each H. pylory colony (mm, mean of triplicate experiment) versus FlaA abundance. H. pylori were recovered from 11 AAG (hollow circle) and from 8 GC patients (filled squares). Dashed line represents the optimal regression line; solid line represents the best fit by linear regression including AAG and GC (n = 19) cases (Y = 0.12 + 0.42x). (C) Analysis of area of spreading versus TLR5 genotype corrected by FlaA abundance covariate.

