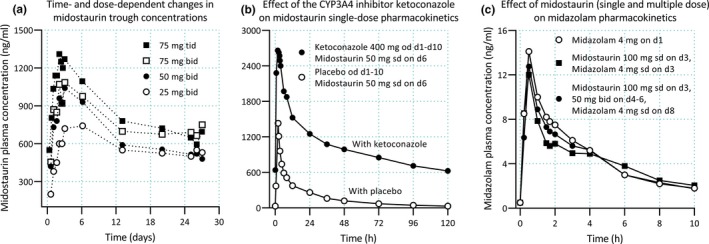
Figure 3.

Pharmacokinetics and drug–drug interactions of midostaurin. (a) Midostaurin exhibits time‐dependent pharmacokinetics, with increasing trough plasma concentrations during the first 3–6 days of therapy, followed by a 60–70% decline in concentrations until a steady state is reached.68, 69 Autoinduction of cytochrome P450 (CYP)3A4 by midostaurin and its two major metabolites is thought to be involved in the time‐dependent pharmacokinetics of midostaurin.69 (b) Midostaurin is a sensitive CYP3A4 substrate, and ketoconazole has increased its SD area under plasma concentration‐time curve (AUC) by more than tenfold.67 (c) Although both midostaurin and its two major metabolites are inducers and mechanism‐based inhibitors of CYP3A4 in vitro, the drug has had no effect on midazolam pharmacokinetics in healthy subjects, following either a single midostaurin dose (100 mg) or 2 days after the last dose of multiple midostaurin doses (50 mg twice daily for 3 days).67 Clinical data shown are from refs. 67 and 68. d, day; od, once daily; sd, single dose; tid, three times daily.
