Figure 4.
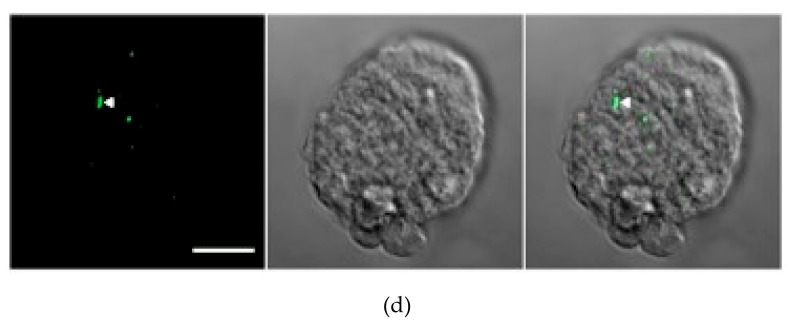
Phenotypic effects of transcriptional gene silencing of ETMP30. (a) cDNA from total mRNA isolated from ETMP30gs and mock control (transfected with pSAP2-Gunma empty vector) strains, respectively, was used as template. Target segments of the genes were amplified using appropriate primers (Table S1). The 15 kDa subunit of RNA polymerase II gene was used as positive control. (b) The specific down-regulation of expression of ETMP30 mRNA was confirmed by quantitative reverse-transcription PCR of the ETMP30 gene in ETMP30gs and mock control cells. The amount of ETMP30 cDNA was normalized relative to that of the gene encoding the 15 kDa subunit of RNA polymerase II. (c) Growth curve of ETMP30gs and mock control strains based on cell count performed at different time points within 80 h. (d) Immunofluorescence analysis using anti-APSK antiserum. Representative micrograph of ETMP30gs strain with slightly elongated mitosome (white arrowhead) stained with anti-APSK antiserum (green). Scale bar, 5 µm.


