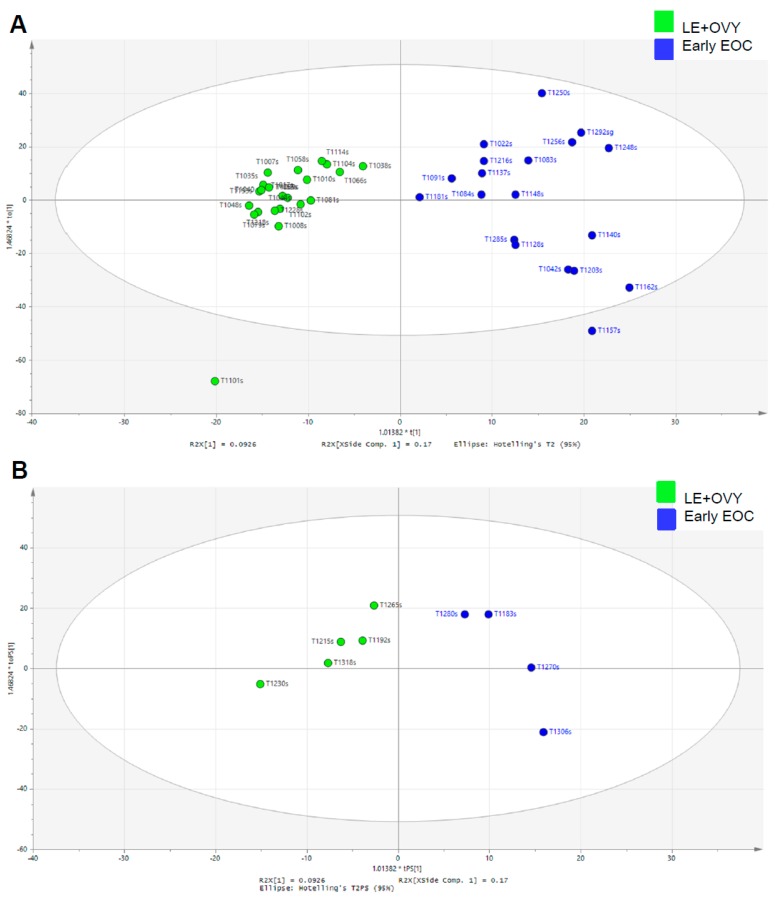
Figure 2.
Glycopeptide spectral data in a cancer group and a non-cancer group. (A) OPLS-DA scatter plot based on the same samples as in panel B. Green dots are LE and OVY samples and blue dots are EOC patients. The ellipse represents 95%CI. (B) Scores plots of the OPLS-DA prediction model for validation set. Green dots are LE and OVY samples and blue dots are EOC patients. The ellipse represents 95% confidence interval. Abbreviations: EOC, epithelial ovarian cancer; LE, leiomyoma; and OVY, ovarian cyst.

