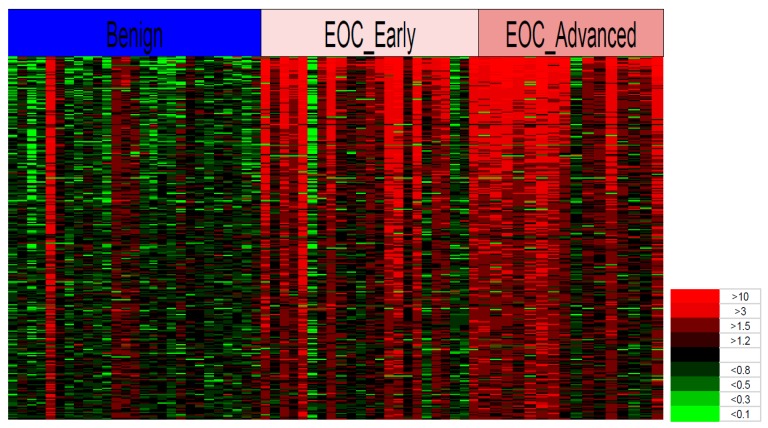
Figure 3.
Heat map of glycopeptides in the blood sera of early-stage EOC, advanced-stage EOC, and non-cancer patients. The Y-axis represents 300 individual glycopeptides in the MS spectra and the X-axis represents the individual patients in the cancer and non-cancer groups. The spectral colors in the matrix represent the ratio level of glycopeptide peaks in the individual compared to the average level in the non-cancer group ranging from the brightest green (<0.1) to the brightest red (>10). Abbreviation: EOC, epithelial ovarian cancer.

