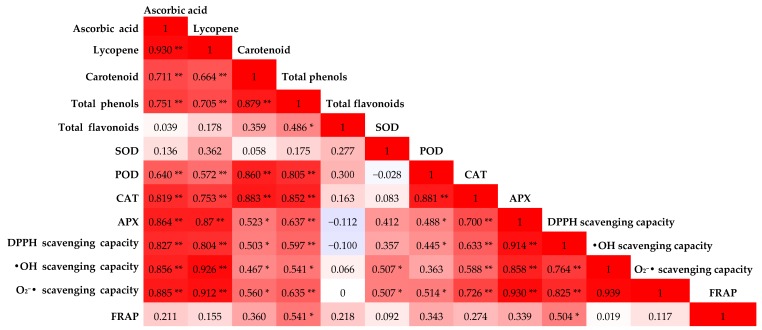
Figure 4.
Correlation matrix based on Pearson’s correlation coefficient between the different antioxidant substances, antioxidant enzymes and antioxidant capacities. The color intensity and numbers are proportional to the correlation coefficients. Positive correlations are shown in red, and negative correlations, in blue. *,** means a significance of p = 0.05 and p = 0.01, respectively.

