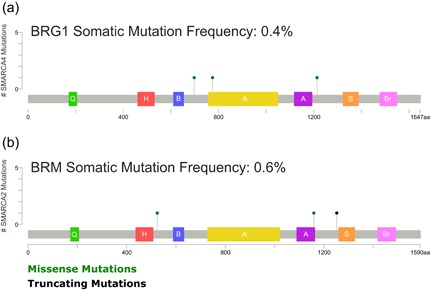
Figure 2.

Schematic diagram of the location of BRG1 and BRM somatic mutations present in TCGA prostate tumor patients relative to known domains of BRG1 and BRM proteins. CBioPortal (Cerami et al., 2012; Gao et al., 2013) was used for data analysis. Domains indicated: Q (green) – QLQ domain, H (red) – HSA domain, B (blue) – BRK domain, A (yellow and purple) – bipartite SNF2 ATPase domain, S (orange) – SnAC domain, Br (pink) – bromodomain. BRG1: Brahma‐related gene 1; BRM: Brahma [Color figure can be viewed at wileyonlinelibrary.com]
