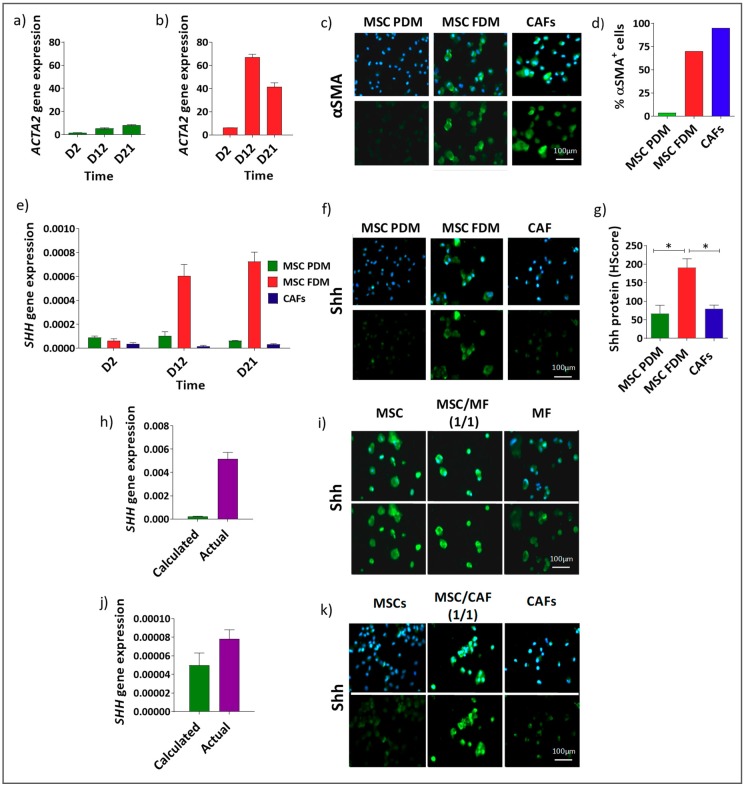
Figure 2.
(a–d) Shh is upregulated in mixed populations of αSMA+ and αSMA− mesenchymal cells: All the representative images in this figure (c,f,i,k) show αSMA− cells in the column on the left; αSMA+/αSMA− mixed population in the central column and αSMA+ cells in the column on the right. ACTA2 gene expression in MSCs grown in PDM (a) and FDM (b). (c) Representative images of αSMA expression in MSCs grown in PDM (αSMA− cells) or FDM (αSMA+/αSMA− mixed population), or CAFs grown in FDM (αSMA+ cells). (d) Percentage αSMA+ and αSMA− cells after 21 days of culture. Analysis of Shh gene (e) and protein (f,g) expression in the same 3 cell models (* p < 0.05 one-way ANOVA multiple comparison test). (h–k) Shh expression in in vitro models of αSMA−/αSMA+ mixed populations. αSMA− cells (MSCs) were mixed at a 1:1 ratio respectively with two different αSMA+ population (MSCs treated with TGFβ) (h,i) and CAFs (j,k). Data were analysed by comparing the actual SHH gene expression detected in these in vitro mixed population models with the calculated average of SHH gene expressions observed in the αSMA− and αSMA+ cells grown separately in the same experiment. Gene (h,j) and protein (i,k) expression confirmed the increased expression of Shh in αSMA−/αSMA+ mixed populations.

