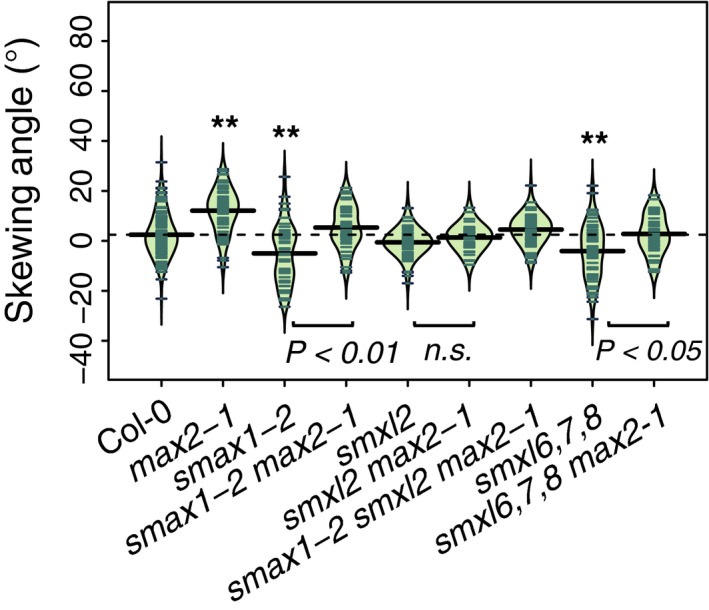
Figure 4.

MAX2 effect on root skewing requires SMAX1, SMXL2 and SMXL6,7,8.
Root‐skewing phenotypes of Col‐0, max2‐1, smax2‐1, smax2‐1 max2‐1, smxl2, smxl2 max2‐1, smax1‐2 smxl2 max2‐1, smxl6,7,8 and smxl6,7,8 max2‐1 while grown at 90°. Data for each genotype are displayed as a beanplot with the skewing angle of individual roots shown as dark green horizontal lines, while the mean is represented by a thick black horizontal line. The estimated density of the distribution is illustrated by the shaded colour. The dashed line corresponds to the mean for the wild‐type. Significant differences compared with wild‐type (Tukey HSD) are shown: *P < 0.05 and **P < 0.01. For each genotype, n > 38 from three experiments.
