Figure 5.

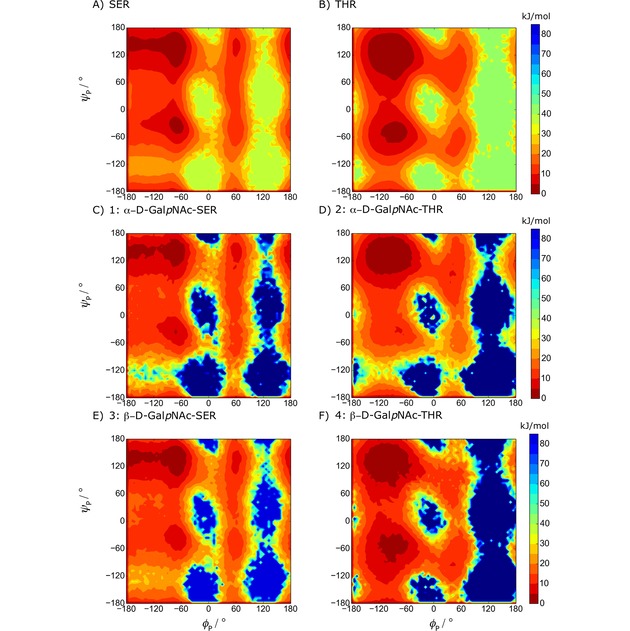
Free‐energy maps G ( , ) of the protein backbone dihedral angles from the LEUS simulations. Colors are explained in Figure 3.

Free‐energy maps G ( , ) of the protein backbone dihedral angles from the LEUS simulations. Colors are explained in Figure 3.