
Figure 6.
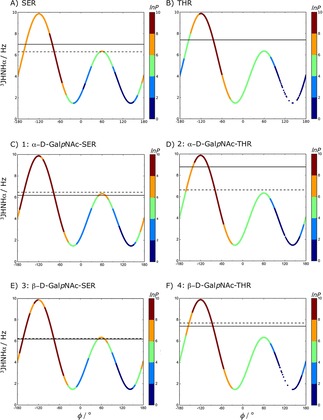
φ P vs. calculated 3JHNHα couplings from LEUS simulations for all studied systems. Experimental and calculated 3J values are represented with solid and dashed horizontal lines, respectively. The colors on this Karplus curve indicate the preferred sampling after unbiasing of the LEUS simulations. In the unbiasing procedure, LEUS occurrences (P) are binned with 6° grid spacing. Negative values of lnP set to zero.