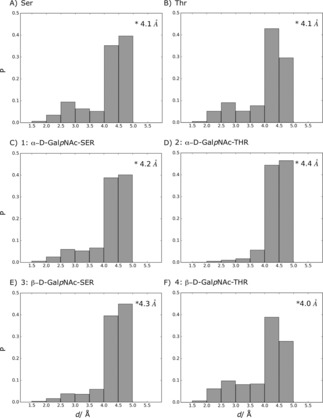
Figure 7.

Calculated HT,H distance (Å) distributions from LEUS simulations after unbiasing. Overall average unbiased distance of each system is represented in the upper‐right corner of every panel. NMR studies reported that extended backbone conformation shows d(HT,H) at 4.4 Å and 4.3 Å for β and PII, respectively.70
