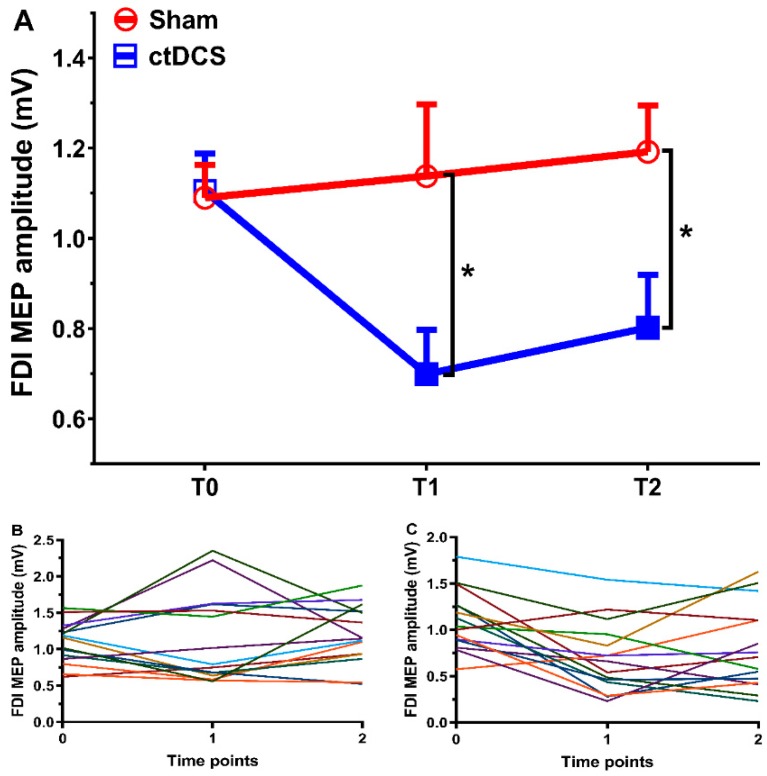
Figure 2.
Results of the study. For time points T0, T1, and T2, averaged MEP amplitudes of the first dorsal interosseus (FDI) muscle for all participants (A) and individual MEP amplitude in the sham (B) and cathodal transcranial direct current stimulation (ctDCS) (C) groups are depicted. Filled symbols indicate significant differences of MEP amplitudes after movement observation and execution in comparison to baseline values. Error bars represent standard error of means. * denotes significant differences between groups at p < 0.05.

