
Figure 6.
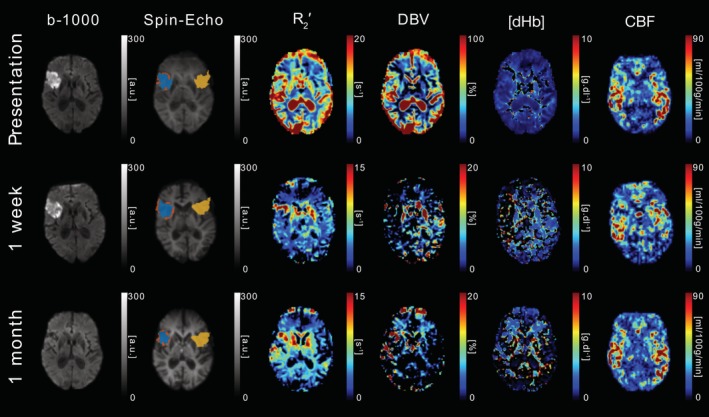
DWI (b = 1,000 s/mm2), sqBOLD parameter maps (R 2′, DBV, and [dHb]) and CBF maps are presented for a single axial slice in an example patient. Core (blue), growth (orange), and contralateral (yellow) tissue outcome ROIs are displayed on the spin‐echo image of the sqBOLD acquisition. Patient P05 (male, 78 years old, NIHSS = 4, no IV thrombolysis) was scanned on presentation (28 hr 20 min postonset) and again at 38 hr and 1 month postinitial scan [Color figure can be viewed at http://wileyonlinelibrary.com]