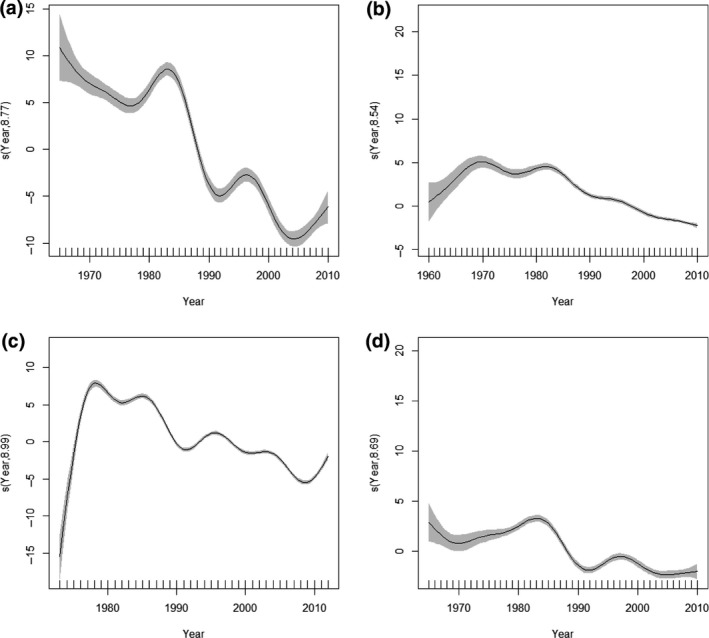
Figure 3.

Year component for a) aphids b) birds c) butterflies and d) moths from the baseline trend model (Equation 1). The estimated smoothed terms are a transformed function of year which on the y‐axis is centred on zero and scaled by the effective degrees of freedom. The graphics show the estimated smoother effects with 95% confidence intervals in grey, where negative trends yield earlier phenologies with increasing time. The x‐axis has two components the major tick marks indicate numerical values and above those are rug plots that show the values for year which are regularly spaced
