
Figure 3.
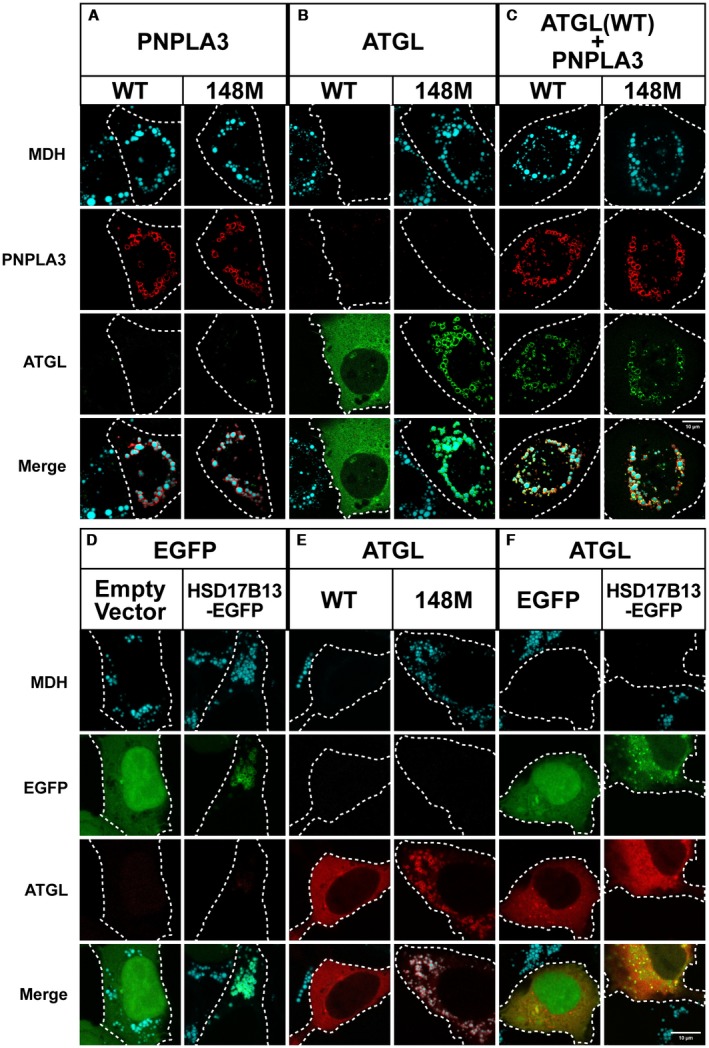
Co‐expression of PNPLA3(WT or 148M) and ATGL in cultured cells. (A‐C) HuH‐7 cells were transfected with PNPLA3(WT or 148M) and GFP‐tagged mouse ATGL and grown in the presence of 200 µM OA as described in Fig. 1. Immunofluorescence was performed as described in Fig. 1. QBI‐293A cells were transfected with enhanced green fluorescent protein (EGFP) and HSD17B13‐EGFP (D), mC‐ATGL(WT or 148M) (E), and ATGL plus EGFP or HSD17B13‐EGFP (F). Cells were transfected and grown in the presence of 200 µM OA as described in Fig. 2. LDs were costained with MDH (cyan). The experiments were repeated 1‐3 times and the results were similar. Scale bar = 10 µm.