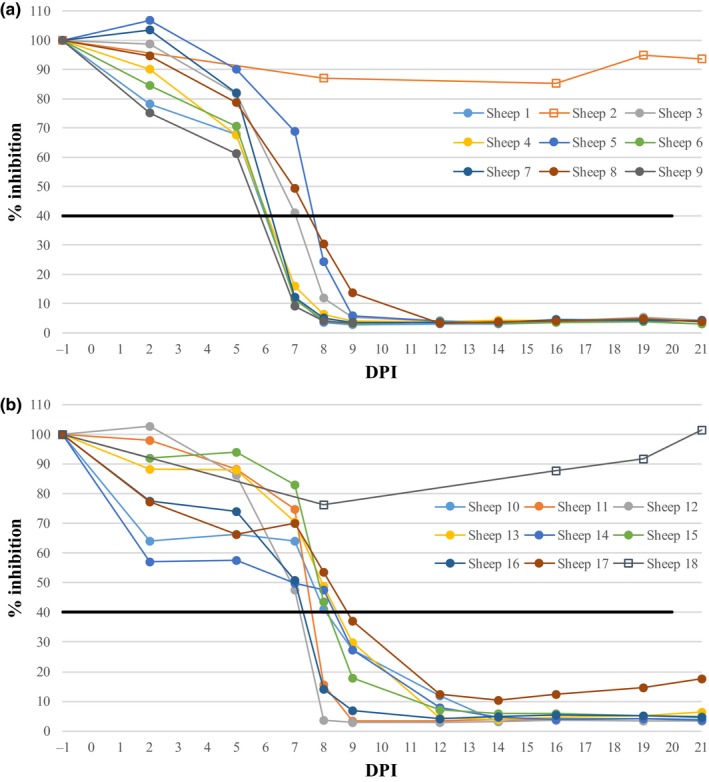
Figure 3.

Antibody response of sheep inoculated with UKG2007 (a) and FRA2017 (b) as determined by C‐ELISA. The dashed line represents the positive/negative cut off of the ELISA whereby values <40% inhibition are considered positive. Sheep 2 and Sheep 18 are the control animals [Colour figure can be viewed at wileyonlinelibrary.com]
