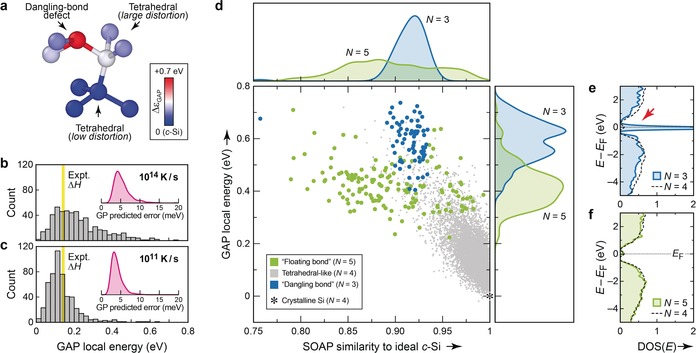
Figure 2.

Machine‐learned atomic energies in a‐Si. a) Sample structural fragment, chosen to represent a dangling‐bond defect with high energy (red), a distorted tetrahedral environment with intermediate energy (white), and a more favorable tetrahedral environment with only low distortion (blue). Atoms are color‐coded according to their GAP atomic energy, ϵi, given relative to that in diamond‐type c‐Si. b) Histogram of atomic energies in the structure quenched at 1014 K s−1. The experimental enthalpy of relaxed a‐Si (from Ref. 19, also relative to c‐Si) is indicated by yellow shading. The Gaussian‐process(GP)‐predicted error is indicated in the inset, showing a kernel‐density estimate for all atoms in the structure (see Supporting Information for details). c) Same analysis as in (b) for the more ordered 1011 K s−1 structure. d) 2D plot revealing the connection between structural order (NN similarity to diamond‐like c‐Si; horizontal axis) and GAP local energy for the individual atoms (vertical axis). Results are collected for all 14 systems, that is, for all quench rates from 1014 to 1010 K s−1 (see Figure 1). Kernel‐density estimates (smoothed histograms) are given for projections on both axes. e), f) Local electronic DOS for a structure quenched at 1011 K s−1 from Ref. 8, illustrating the very different electronic fingerprints of three‐ and fivefold‐bonded coordination defects. DOS plots are normalized per atom; for comparison, the average local DOS for all fourfold bonded atoms in the same structure is given by dashed lines. The red arrow in (e) highlights the mid‐gap states associated with dangling‐bond defects.
