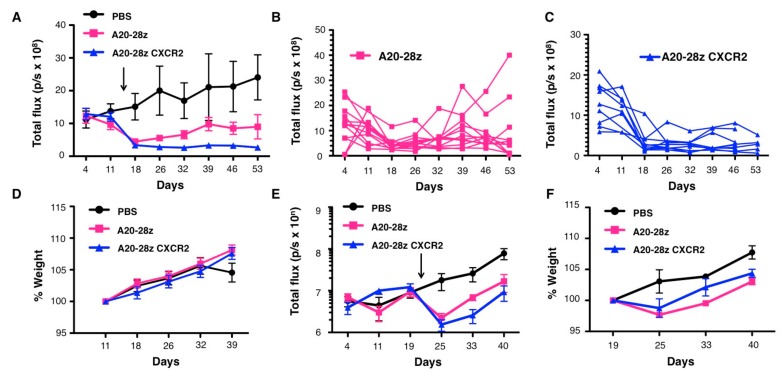
Figure 5.
Improved therapeutic efficacy of chemokine-responsive CAR T-cells in vivo. (A) Mice were injected using the intraperitoneal (IP) route with 2 × 10⁶ Panc04.03-firefly luciferase cells and tumors were allowed to establish for 14 d before IP treatment with a single dose of 2 × 10⁷ of the indicated gene-modified T-cells. The arrow indicates the day of treatment with CAR T-cells. Control mice received phosphate buffered saline (PBS). Bioluminescence imaging using d-luciferin (substrate for ffluc) was used to monitor tumor status. Data show the mean ± SEM of tumor-derived total flux of 9–12 mice per group pooled from two independent experiments. * p < 0.05 comparing A20-28z vs. A20-28z CXCR2 (unpaired, two-tailed Student’s t-test). Bioluminescence emission from A20-28z (B) and A20-28z CXCR2-treated mice (C) are also shown. (D) Weight of treated mice relative to pre-treatment weight (mean ± SEM pooled from 2 independent experiments). (E) Mice were injected IP with 1 × 10⁶ SKOV3-firefly luciferase cells and tumor burden monitored thereafter using bioluminescence imaging. After 21 days, mice were treated with a single dose of 2 × 10⁷ of the indicated gene-modified T-cells (arrowed). Control mice received PBS. Tumor burden and weight (expressed relative to pre-treatment weight; F) was monitored weekly (mean ± SEM, n = 5 mice per group).

