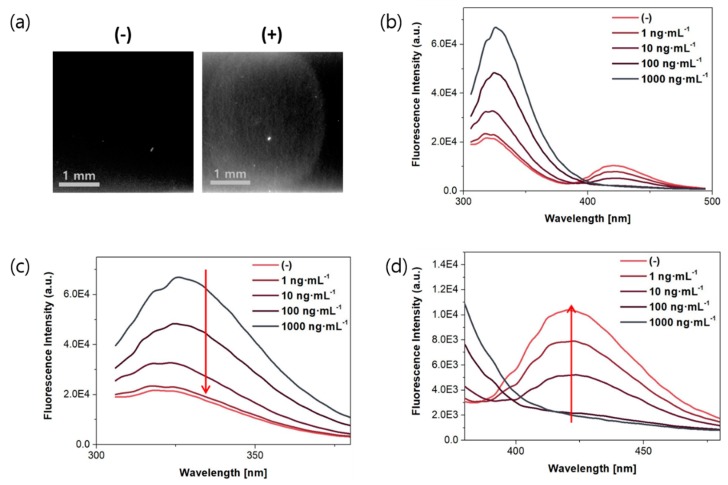
Figure 2.
Fluorescence images and emission spectra of anti-OTA antibody (0.44 mg∙mL−1) upon exposure to different concentrations of OTA in 25 mM 4-morpholineethanesulfonic acid hydrate (MES) buffer (pH 6.0) with 0.3% tween 20 (λex = 280 nm). (a) Fluorescence images in a nitrocellulose membrane without OTA (left) and with OTA (right) with a bandpass filter (450/40) (λex = 254 nm), and fluorescence spectra in different wavelengths (b) from 300 to 500 nm; (c) from 300 to 380 nm; and (d) from 370 to 480 nm.

