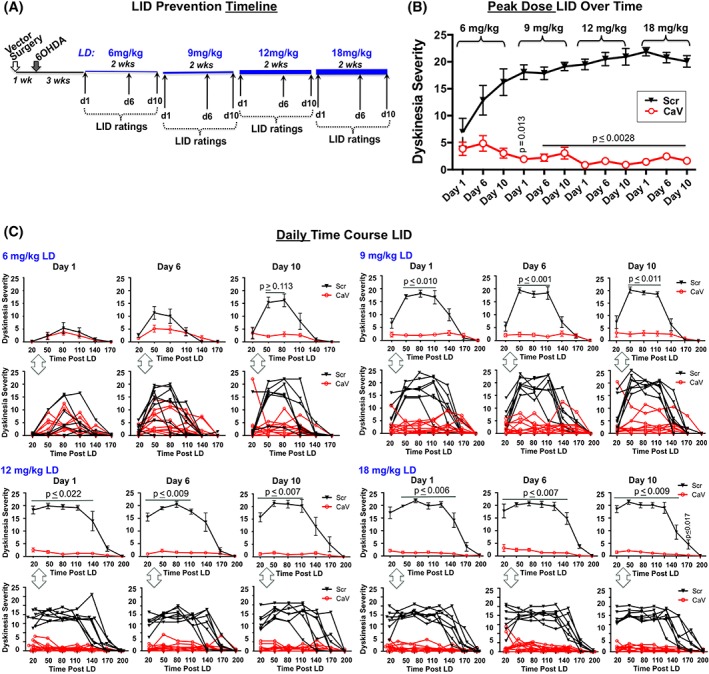
Figure 1.

LID prevention study. (A) Treatment timeline. (B) Peak dose LID severity (80 minutes postlevodopa) across time and doses. (C) Daily time course (20‐170/200 minutes postlevodopa). For each dose and day, the top graphs reflect mean ± SEM; bottom graphs show individual subject responses over time. Statistics: Friedman and Kruskal‐Wallis tests with Dunn's multiple‐comparison post hoc as shown in graphs. Scr, rAAV‐Scrambled‐shRNA (n = 7); CaV, rAAV‐CaV1.3‐shRNA (n = 10). [Color figure can be viewed at wileyonlinelibrary.com]
