
Figure 2.
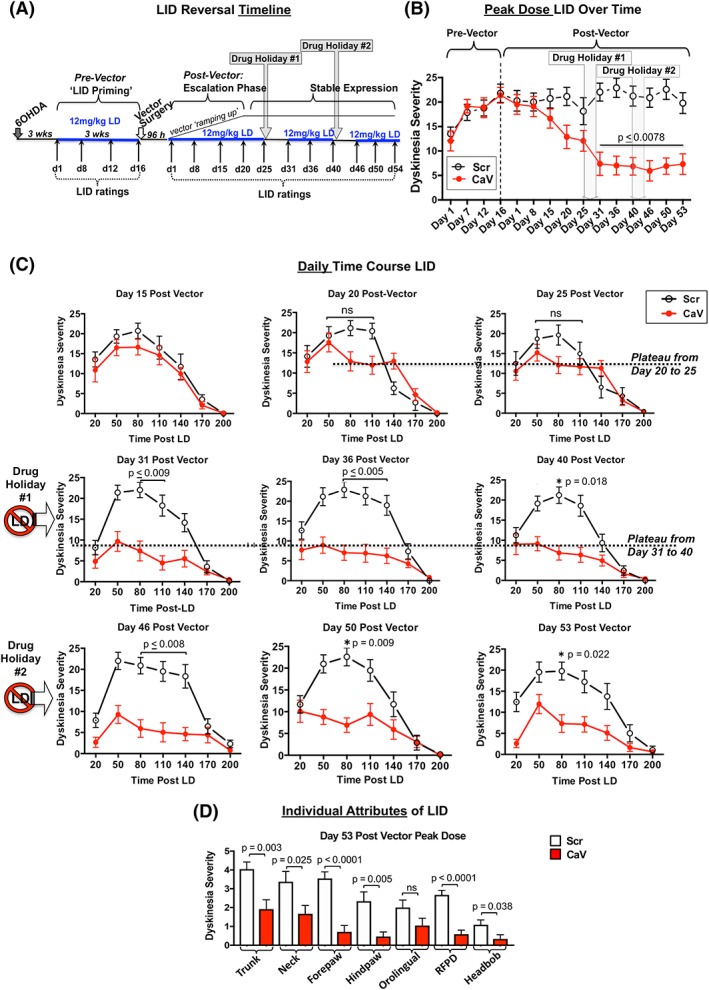
LID reversibility study. (A) Treatment timeline. (B) Peak‐dose LID severity (80 minutes postlevodopa) across time. (C) Daily time course of LID behavior ranging from 20 to 200 minutes postlevodopa on each rating day. (D) Individual attributes of LID. As seen in this depiction of peak LID behaviors on day 53 postvector, the impact of CaV1.3 channel silencing appears to uniformly reduce all aspects of LID and is not selective on any particular attribute. As shown in the timeline, (A) all rats received daily high‐dose (12 mg/kg) levodopa at all times indicated. Data represent the mean ± SEM. Statistics: Kruskal‐Wallis tests with Dunn's multiple‐comparison post hoc as shown in graphs. LD, levodopa; Scr, rAAV‐Scrambled‐shRNA (n = 12); CaV, rAAV‐CaV1.3‐shRNA (n = 11). [Color figure can be viewed at wileyonlinelibrary.com]