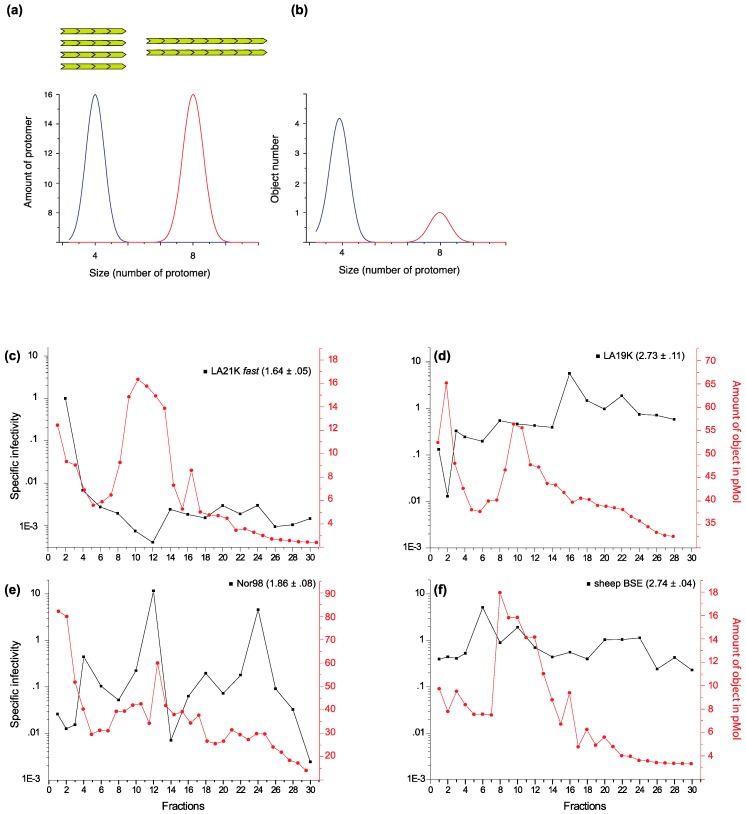
Figure 1.
Size distribution of PrPSc assemblies and of their specific infectivity among different ovine prion strains. (a,b) Illustration describing the SV profile of two sets of assemblies (A and B) equivalent to the total number of protomers but different in terms of size. The sedimentogram is expressed as a function of protomer amount (a) or object number (b). The object number is also representative for the templating interfaces by assuming that templating can occur at least by one of the extremities. (c–f) SV profiles of ovine prion strains (original data from [25]). The specific infectivity of the SV-fractionated assemblies (black line) was calculated by dividing the relative infectivity of the assayed fraction by the relative amount of protease-resistant PrPSc. The relative infectivity values were obtained from survival time bioassays in reporter tg338 mice. Specific infectivity values of (c) LA21K fast scrapie strain classified as fast strain (mean survival times of 56 days in tg338 mice), (d) LA19K (133 days), (e) Nor98 (186 days) and (f) sheep BSE (135 days), as slow strains. The amount of PrPSc assemblies in terms of object (red line) has been estimated by dividing the sedimentogram expressed in the equivalent of monomeric PrP by the theoretical fraction-molecular weight correspondence after calibration of the gradient for molecular weight [25]. The guanidine hydrochloride denaturation values of each strain are indicated ([Gdn]1/2 values in mol/L ± SEM, data from [23]).

