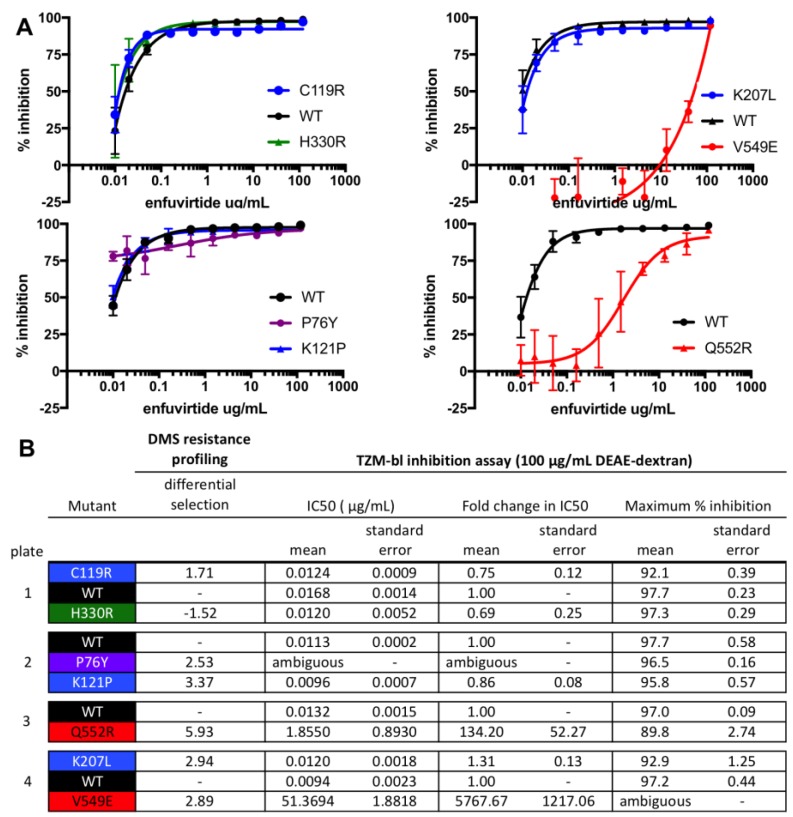
Figure 3.
Validation of enfuvirtide resistance mutants using a TZM-bl inhibition assay. TZM-bl inhibition assays were performed in the presence of 100 μg/mL DEAE-dextran, similar to the resistance profiling. (A) Inhibition curves are the average of two biological replicates, each performed in duplicate. (B) The IC50, the fold change in IC50 relative to wildtype (WT), and the maximum percent inhibition for each mutant, determined from the fit four-parameter logistic curves. WT virus was run on each plate, and each mutant virus curve was compared to the plate internal WT control. The standard error of the mean is also shown. H330R, which was not enriched in the resistance profiling, was included as a control. In (A,B), mutant pseudoviruses are colored according to groups (black: WT; green: control mutant not expected to affect enfuvirtide sensitivity; blue: mutants in the V1/V2 Stem/co-receptor binding site; red: mutants in/near NHR binding site).

