Figure 2.
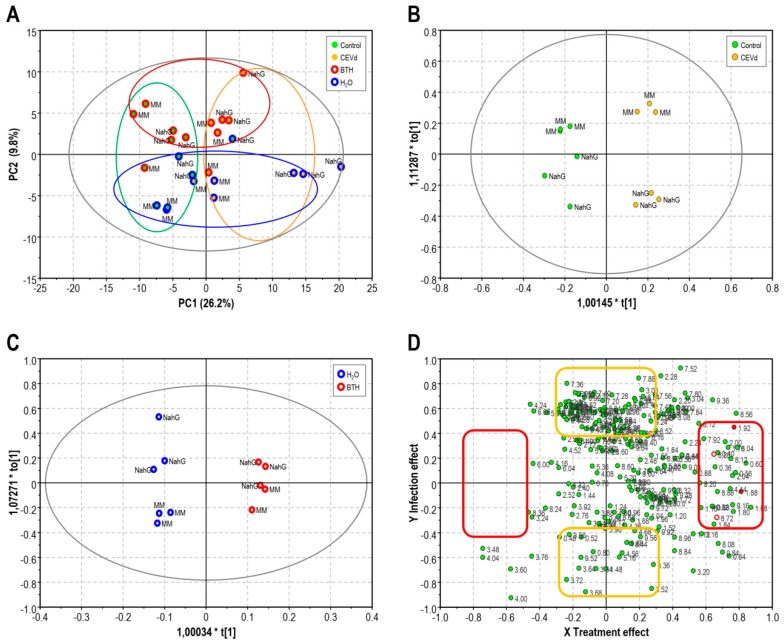
Multivariable data analysis based on the 1H-NMR signals, in the range of 0.3–10.0 ppm, of the Money Maker (MM) and NahG tomato plants after viroid inoculation and BTH treatments at 3 weeks post infection (green; mock tomato leaves, yellow; tomato leaves infected by CEVd, red; leaves after BTH treatments blue; leaves after H2O treatments). (A) Score plot of partial least square (PLS) (B) Score plot of orthogonal projection to latent structures-discriminant analysis (OPLS-DA) of the infection (R2 = 0.95, Q2 = 0.82). (C) Score plot of OPLS-DA of chemical treatment (R2 = 0.99, Q2 = 0.93). (D) Shared-and-unique-structures (SUS) plot correlating the two OPLS-DA models with the Y axis as CEVd infection and X axis as BTH treatment (1H-NMR signals of GABA in red full circles and 1H-NMR signals of hydrolyzed BTH in red open circles).

