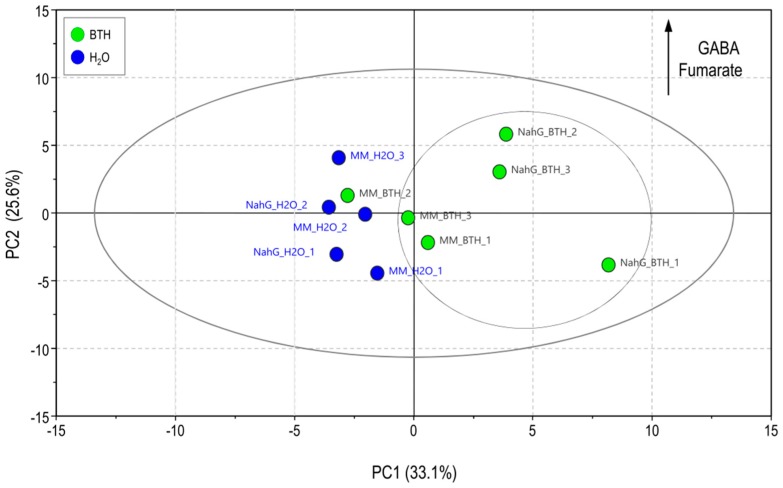
Figure 5.
Score plot of principal component analysis (PCA) based on the characteristic ion of the mass spectra from the primary metabolites measured in the m/z range 35–900, of the Money Maker (MM) and NahG tomato plants after at 48 h after BTH treatments (green; leaves after BTH treatments; blue; leaves after H2O treatments).

