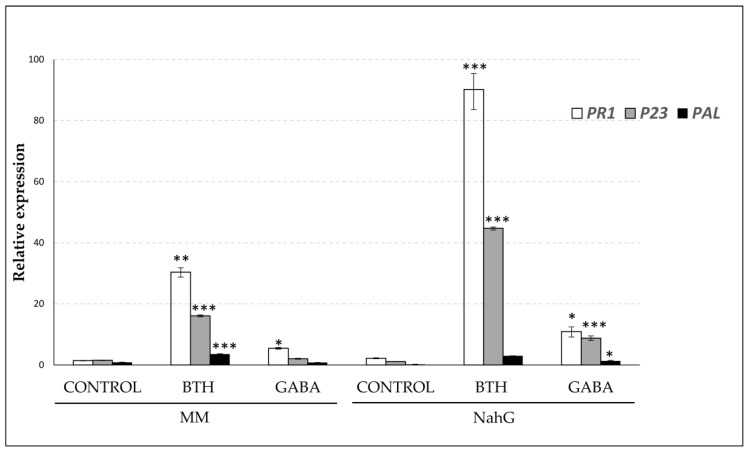
Figure 8.
Expression levels of the tomato PAL, PR1 and P23 genes in Money Maker and NahG tomato plants, non-treated (CONTROL) and 48 h after BTH or GABA treatments. Values were first normalized to the actin expression level. Expression levels are represented as mean ± standard error of three biological repetitions. Asterisk (*), double asterisks (**) and triple asterisks (***) indicate significant differences between chemically-treated and non treated plants with p < 0.05, p < 0.01 and p < 0.001, respectively.

