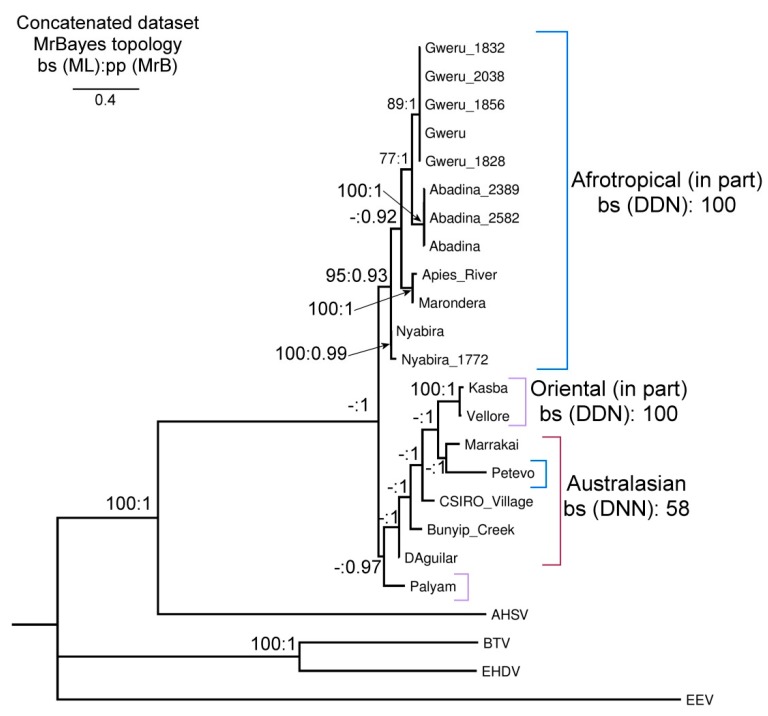
Figure 2.
Phylogenetic tree for the concatenated dataset of the Palyam serogroup of orbiviruses used in this study. Bootstrap values from the Maximum Likelihood analysis were superimposed on the posterior probabilities gained from Bayesian analysis (bs: pp), bs values <75 and pp values <0.9 are not displayed and are represented by a “-“.

