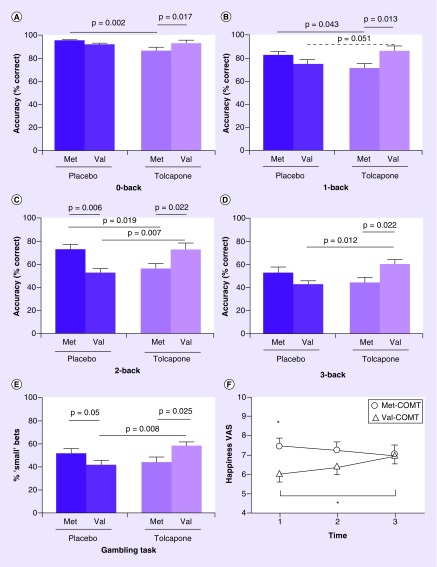
Figure 5. Interactive behavioral effects of catechol-O-methyltransferase genotype and catechol-O-methyltransferase inhibition.
(A) 0-back: main effect of drug (F[1,56] = 4.14; p = 0.047) and genotype × drug interaction (F[1,56] = 6.75; p = 0.012). Met-COMT subjects given tolcapone perform worse than those given placebo. (B) 1-back: genotype × drug interaction (F[1,56] = 9.26; p = 0.006). Tolcapone impairs performance in Met-COMT subjects and, as a trend, improves it in Val-COMT subjects, compared with their respective placebo groups. (C) 2-back: genotype × drug interaction (F[1,56] = 13.62; p = 0.001). Met-COMT subjects perform better than Val-COMT subjects on placebo. Tolcapone reverses this difference, impairing Met-COMT subjects and enhancing Val-COMT subjects, compared with their respective placebo groups. (D) 3-back. Genotype × drug interaction (F[1,56] = 8.03; p = 0.006). Val-COMT subjects given tolcapone perform better than those given placebo. (E) Gambling task, showing percentage of times when 5 not 25 was gambled. Genotype × drug interaction (F[1,61] = 7.91; p = 0.007). On placebo, Met-COMT subjects are more likely than Val-COMT subjects to make a small rather than a large bet. Tolcapone reverses this difference, making Val-COMT subjects significantly more risk averse, compared with those given placebo. (F) Happiness VAS ratings for tolcapone-treated subjects. Data are adjusted means with standard errors. Time 1: immediately before drug administration. Time 2: T1 + 90 min. 3: T1 + 210 min.
*p = 0.026.
VAS: visual analogue scale.
Reproduced with permission from [150] under the terms of the Creative Commons Attribution License (CC-BY) https://creativecommons.org/licenses/by/4.0/

