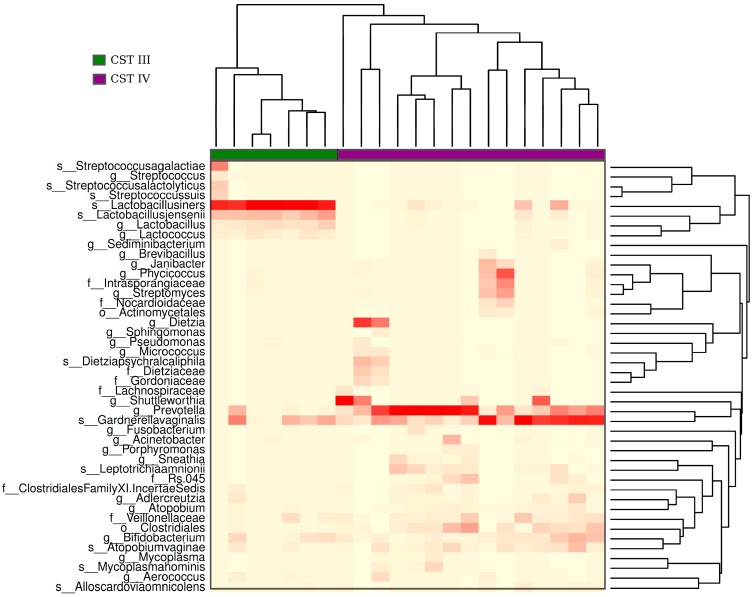
Figure 5.
Heatmap of hierarchical clusterization of the bacteriome present in the analyzed samples. The heatmap shows the abundance of bacteria within the samples. The color gradient of red to white in the heatmap represents the gradient of high to low abundance of bacterial species, respectively. Based on the abundance of bacteria, samples were clustered into two groups: CST (community state type) III (green) and IV (purple). CST III exhibits a high abundance of Lactobacillus iners and CST IV shows a mix of bacterial species, with a high abundance of Prevotella and Gardenerella.

