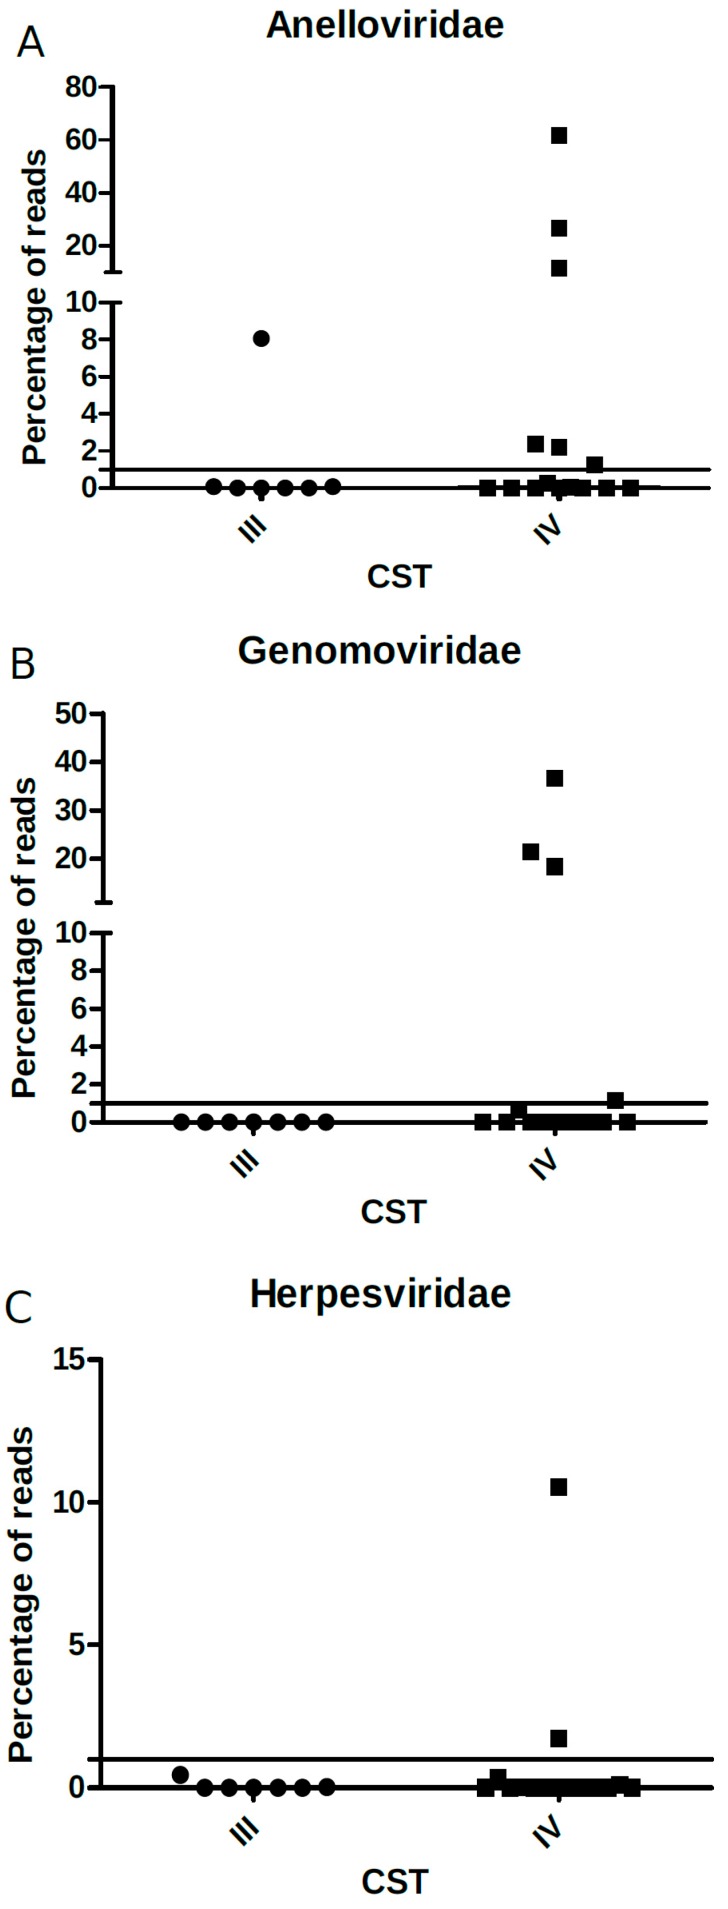
Figure 7.
Percentage of (A) Anelloviridae, (B) Genomaviridae, and (C) Herpesviridae viral reads (y-axis) relative to each CST type (x-axis). The solid black line depicts the proportion of 1% in the y-axis and each point within the graph represents one sample analyzed (circles: CST III; squares: CST IV).

