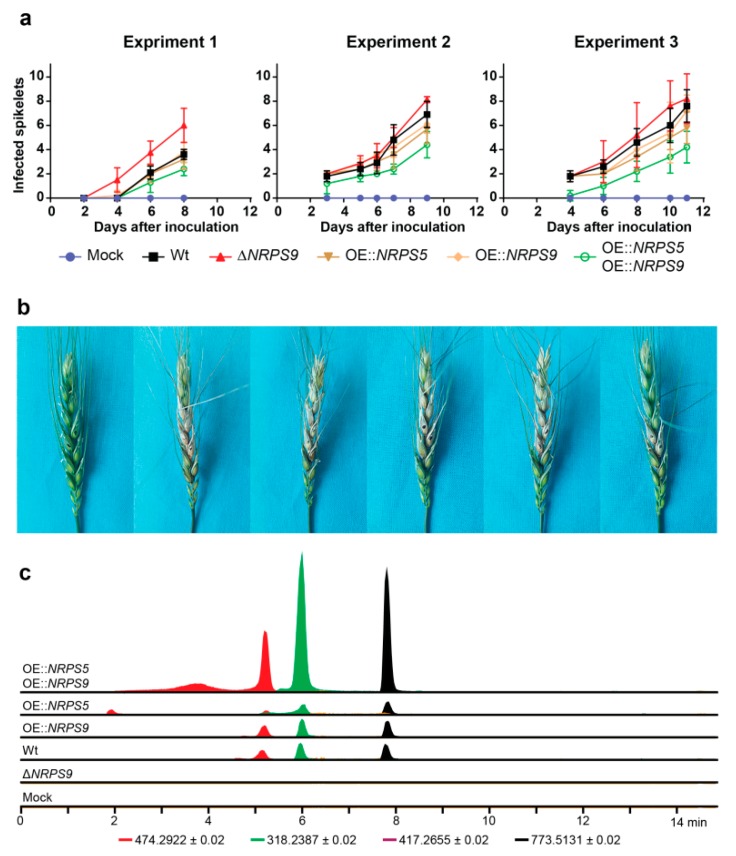
Figure 3.
(a) Wheat head infection of F. graminearum strains in three independent experiments. Each point represent means of five heads and error bars are based on standard deviation. (b) Representative wheat heads collected at harvest in experiment 2. (c) Extracted ion chromatograms of metabolite extracts of wheat heads from experiment 2 for fusapentaxin A (red), fusatetraxin A (yellow), fusatrixin A (green), and fusaoctaxin A (black).

