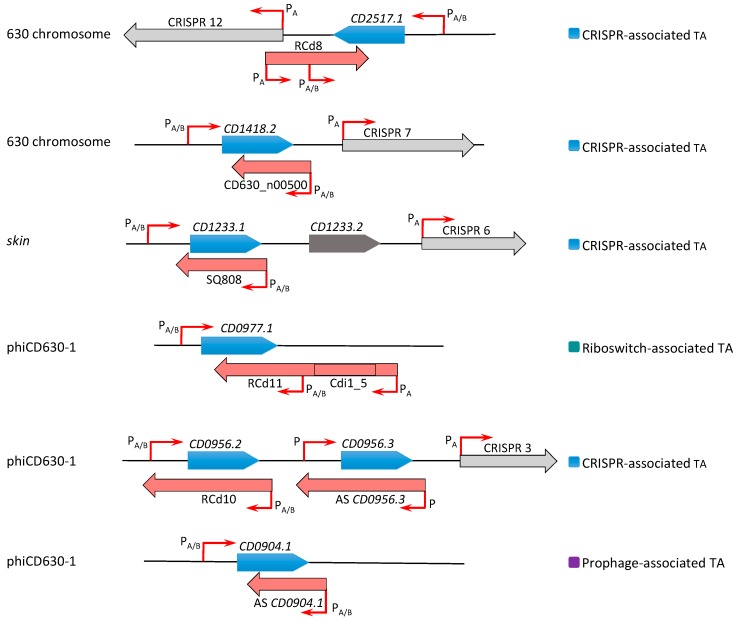
Figure 3.
Schematic representation of type I TA regions in the C. difficile chromosome. Toxin coding regions are shown as blue arrows, antitoxins are shown in red, and CRISPR arrays in grey. The broken red arrows indicate the position of transcriptional start sites associated with “PA” for Sigma A- or “PA/B” for Sigma A- and Sigma B-dependent promoters. The specific genomic region including prophage is indicated to the left. On the right, the association with CRISPR arrays or c-di-GMP-dependent riboswitches is shown with the same colour code as in Figure 1.

