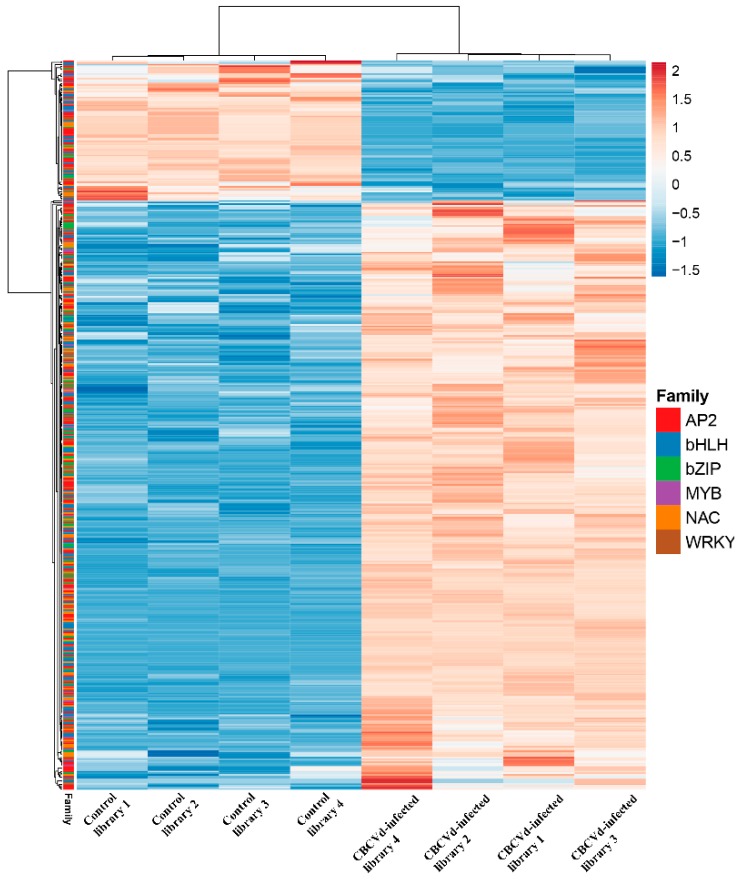
Figure 3.
RNA-seq transcript abundance of Citrus bark cracking viroid (CBCVd) infected and control (healthy) hop plants. The values are expressed as the log2 value of average fragments per kilobase of exon per million fragments mapped (FPKM) per sample. The heatmap with clustering was drawn using the online Clustvis tool.

