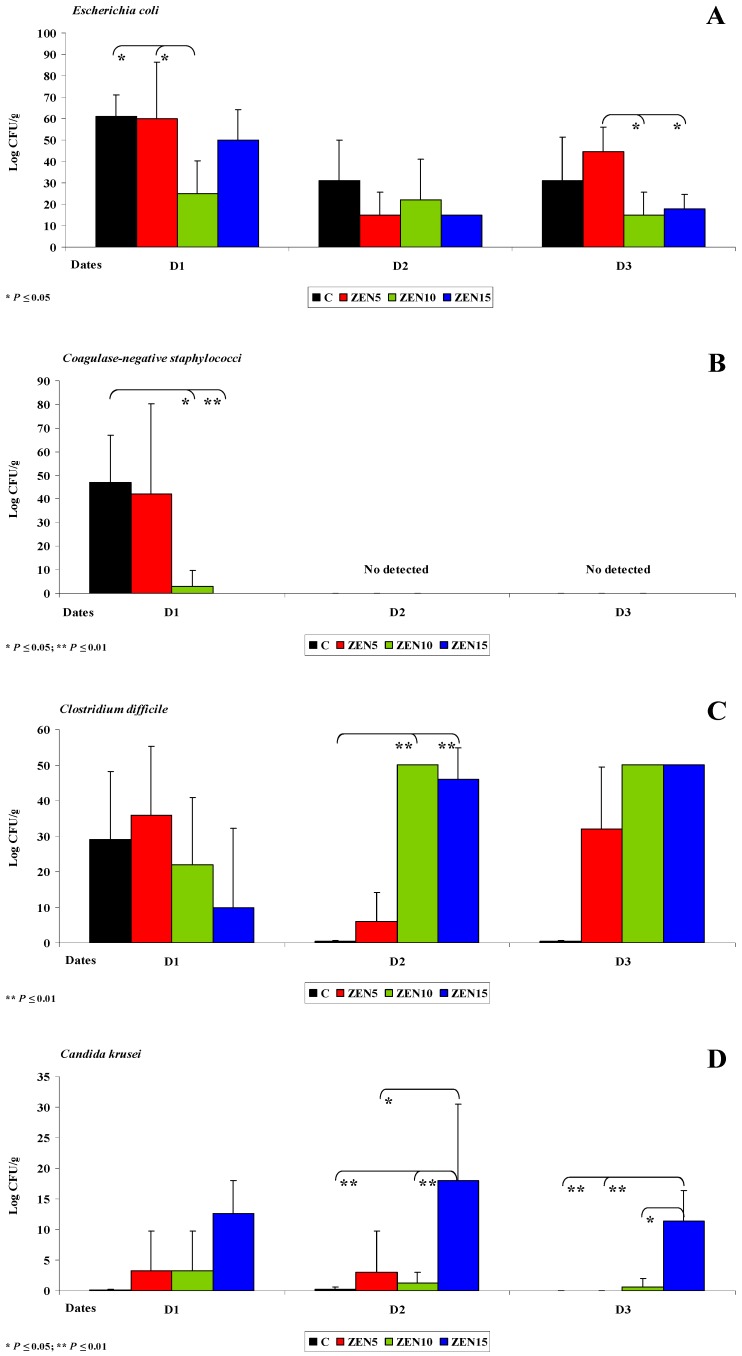
Figure 5.
The dose effect of ZEN on functional diversity in the descending colon microbiome: (A–D) arithmetic means () and standard deviation (SD) in five samples collected on each analytical date (D1, D2 and D3) in the evaluated groups (C, ZEN5, ZEN10 and ZEN15). Statistically significant differences: * at p ≤ 0.05 and ** p ≤ 0.01.

