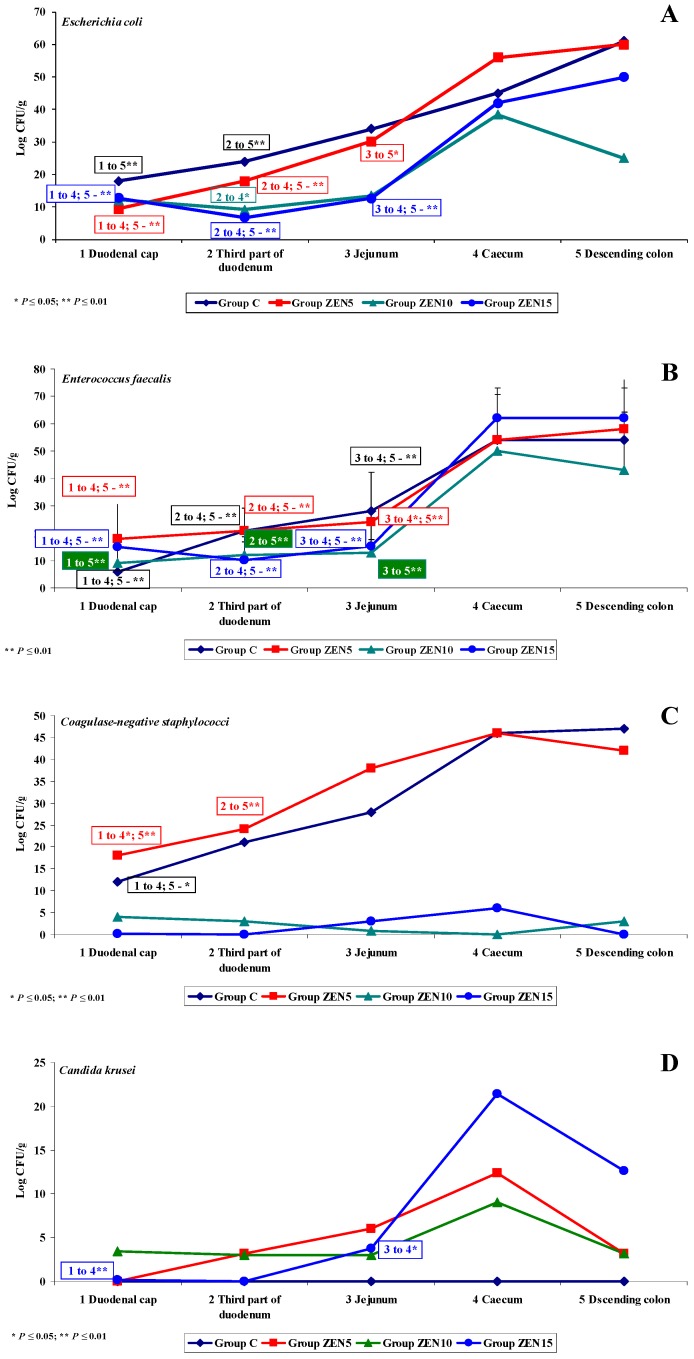
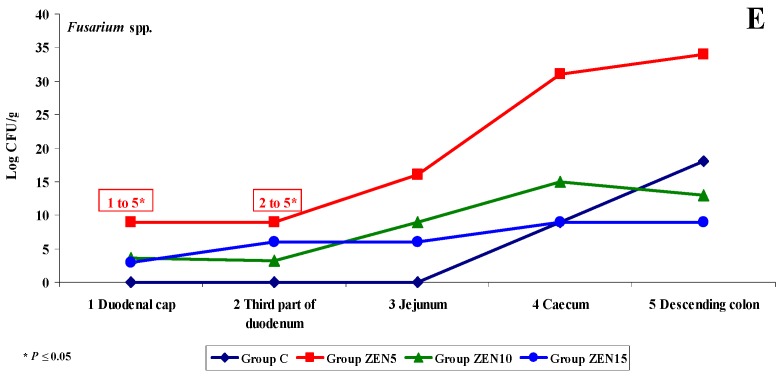
Figure 6.
Variability of microbiota. Variations in the counts of selected microbiota and mycobiota under exposure to ZEN on the first analytical date (D1): (A–E) arithmetic means () in five samples of selected bacterial strains (Groups C, ZEN5, ZEN10 and ZEN15). Statistically significant differences: * at p ≤ 0.05 and ** p ≤ 0.01.


