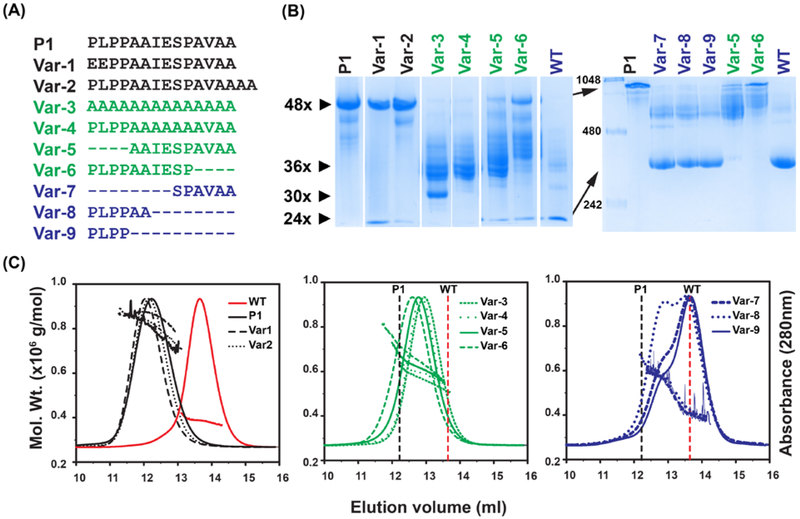
Figure 1. Characterization of the oligomers formed by insertion of peptides in Hsp16.5.
A, Sequences of the peptides inserted in the Hsp16.5 sequence between residues 33-34. The variants are grouped by color according to oligomeric properties shown in panels B and C. B, BN-PAGE. Left panel, 5% acrylamide gel; right panel, 7.5% acrylamide gel (STAR Methods). The approximate number of subunits corresponding to band mobility is shown with small arrows on the left side of the left panel. The molecular weight marker is shown in the first lane of the right panel. Large arrows highlight mobility differences of the P1-insert and WT constructs in the 7.5% acrylamide gel. Lanes have been rearranged according to variants after documenting the gels. C, SEC-MALS analysis of purified variants. Variants are grouped according to similar characteristics. The molecular mass range that is sampled across the elution peak is indicated by the slope of the line for each variant. The vertical lines benchmark the WT (dotted red) and the P1-insert (dotted black) elution peak. (See also Figure S2 and Table S2)

