
Figure 3. MPC inhibition delays proliferation and disrupts TCA outputs in AR-driven PCa models.
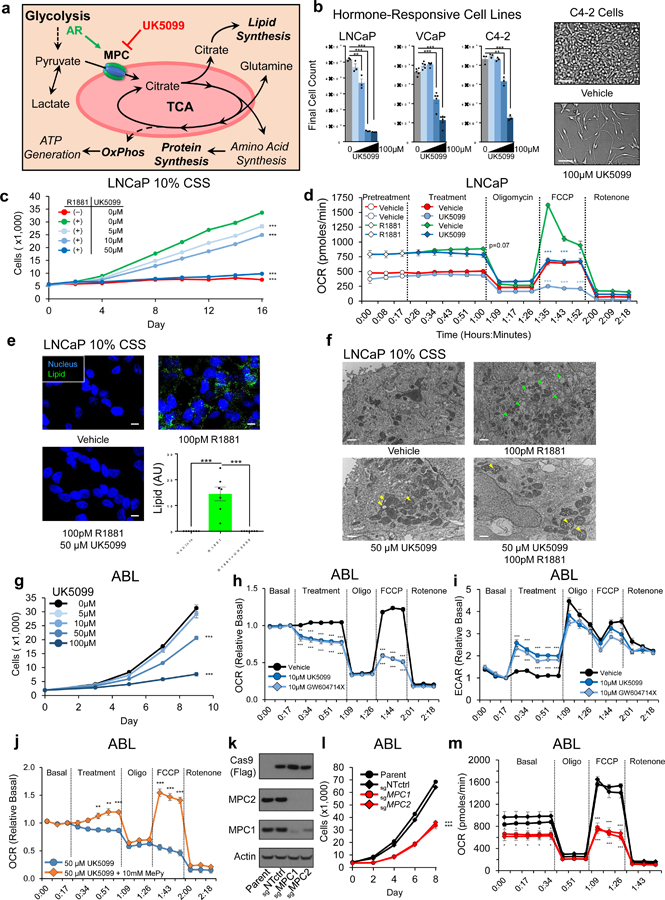
a, Model depicts metabolic and biosynthetic outputs of the TCA in relation to glycolysis and the MPC. b, Hormone-responsive AR-driven cell lines were treated with 0, 5µM, 10µM, 50µM, or 100µM of MPC inhibitor UK5099. Cells proliferation was quantified using in-situ image-based analysis on the final day of the experiment. Scale bar is 100 µm; n=3 (LNCaP, C4–2) or n=5 (VCaP) independent wells per treatment. c, LNCaP cells in 10% hormone-depleted CSS growth media were treated with 100pM of synthetic androgen R1881 with or without UK5099. Cell proliferation was assessed using image-based cell counting; n=5 independent wells per treatment. d, Oxygen consumption rate (OCR) was assessed in LNCaP cells pretreated for 72h; vehicle or 5µM UK5099 was injected at the indicated timepoint. e, LNCaP cells in 10% CSS were treated for 96h and then stained for neutral lipids (LipidTOX). Scale bar is 10µm. f, LNCaP cells were treated for 96h and then imaged using TEM. Green arrowheads specify lipids, yellow arrowheads specify swollen mitochondrial cristae. Scale bar is 1 µm; n=3 independent experiments per treatment and approximately 15 images from each treatment were collected from different grids with representative images shown g, Proliferation during MPC inhibition in castrate-resistant ABL cells was quantified as in (c); n=6 independent wells per treatment. h,i, Metabolic potentials in ABL cells were assessed by measuring OCR (h) and the rate of extracellular acidification (ECAR) (i). j, OCR was assessed in ABL cells supplemented with membrane-bypassing methyl-pyruvate (MePy) during UK5099 treatment. k, Immunoblot of ABL cells with Cas9-mediated genetic disruption of the MPC1 or MPC2 locus. sgNTctrl is a non-targeting sgRNA and parent is unmodified cells. l,m, Proliferation (l) and OCR (m) were assessed in the cells described in (k); n=5 independent wells per treatment for proliferation experiment in panel l. n=7 fields from 3 independent cover slips per treatment for lipid staining in e. n=5 independent wells per treatment for ECAR & OCR experiments in panel d, h, i, j, and m. Data in bar and line graphs are represented as the mean ± SEM. Statistical analysis was performed using a two-tailed Student’s t-test *p < 0.05, **p < 0.01, ***p < 0.001.