
Figure 4. MPC inhibition disrupts TCA function and prevents cell cycle progression.
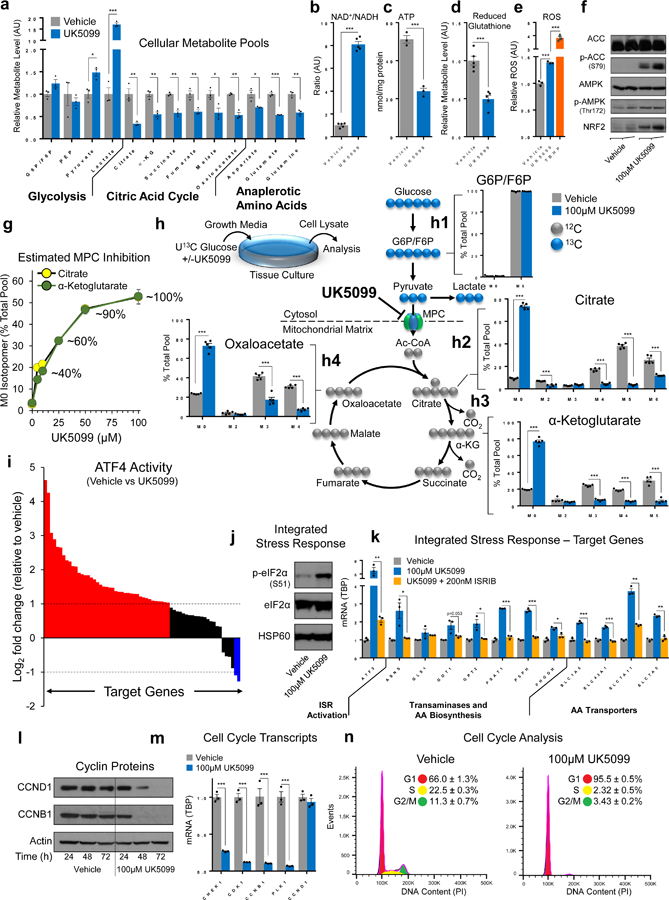
a, Metabolites were quantified in ABL cells treated for 2h. b-e, NAD+/NADH (b), ATP (c), reduced glutathione (d), and ROS (e) were quantified in ABL cells; treatment was applied for 6h (b), 48h (c), 2h (d), or 1h (e). f, p-ACC, p-AMPK, and NRF2 were assessed via immunoblot in ABL cells treated for 72h; AMPK and ACC are loading controls. g, Functional UK5099-mediated MPC inhibition was assessed by incubating ABL cells with U13C glucose and measuring the M0 isotopomer of citrate and α-ketoglutarate after 48h. h, Glucose incorporation into TCA metabolite pools was quantified by pretreating ABL cells for 2h (vehicle or UK5099), then adding U13C glucose for 48h. i, ATF4 activity was assessed by RNA-sequencing in ABL cells treated for 72h (see supplementary fig. 4c). Average log2 fold change (FC) of known ATF4 target genes is plotted; FC>1 are red, FC<1 are blue, and all others are black. j, ISR activity was assessed via immunoblotting in ABL cells treated for 24h. k, Transcriptional activation of the ISR was assessed via qPCR in ABL cells treated for 6h. ISRIB is a small molecule that inhibits the ISR. l, Cyclin content was assessed via immunoblot in ABL cells. m, Cell cycle-dependent mRNA transcripts were assessed in ABL cells treated for 48h. n, Cell cycle distribution was assessed using flow cytometry in ABL cells treated for 48h. n =3 independent cultures per treatment for metabolite measurements in a, c, e, and g. n=5 independent cultures per treatment for metabolite measurements in b, d, and h. For immunoblots, the experiment was performed 2 (l) or 3 (f, j) independent times with similar results and a representative blot with one biological replicate per lane is illustrated. n=3 biological replicates for RNA sequencing (i), qPCR (k and m), and cell cycle analysis (n). 100µM UK5099 used in all experiments in this figure unless otherwise indicated. Data in bar and line graphs are represented as the mean ± SEM. Statistical analysis was performed using a two-tailed Student’s t-test *p < 0.05, **p < 0.01, ***p < 0.001.