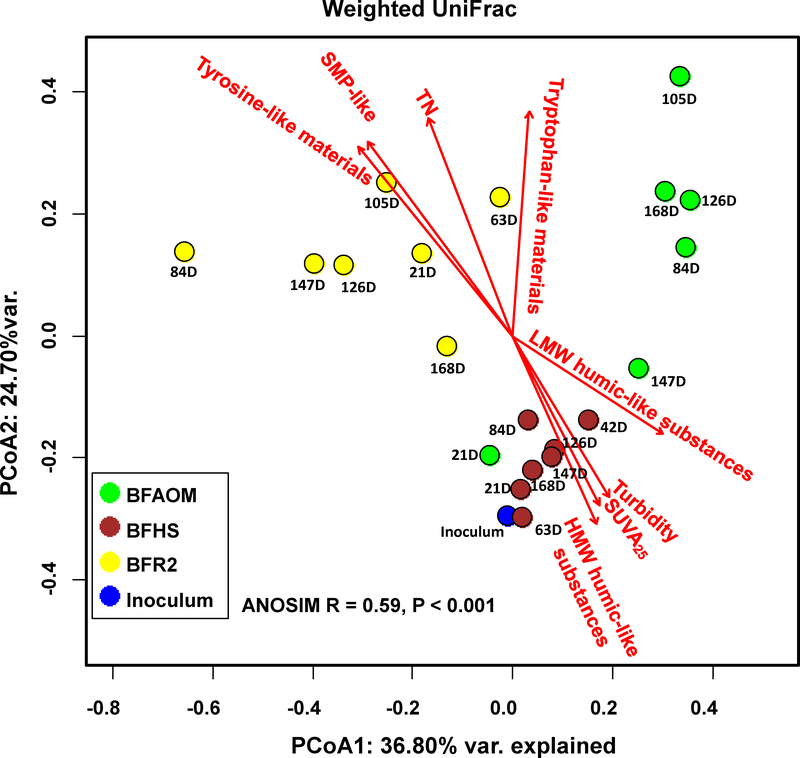
Fig. 4.
Principal coordinate analysis (PCoA) derived from the weighted UniFrac distance matrix of phylogenetic bacterial community structures. PCoA1 and PCoA2 explained 36.80% and 24.70% of the total variance, respectively. The strength of statistically significant (P < 0.05) explanatory variables is shown with solid red arrows. For each biofilm sample, the DNA extracts from two biofilm grown-coupons were used for sequencing.

