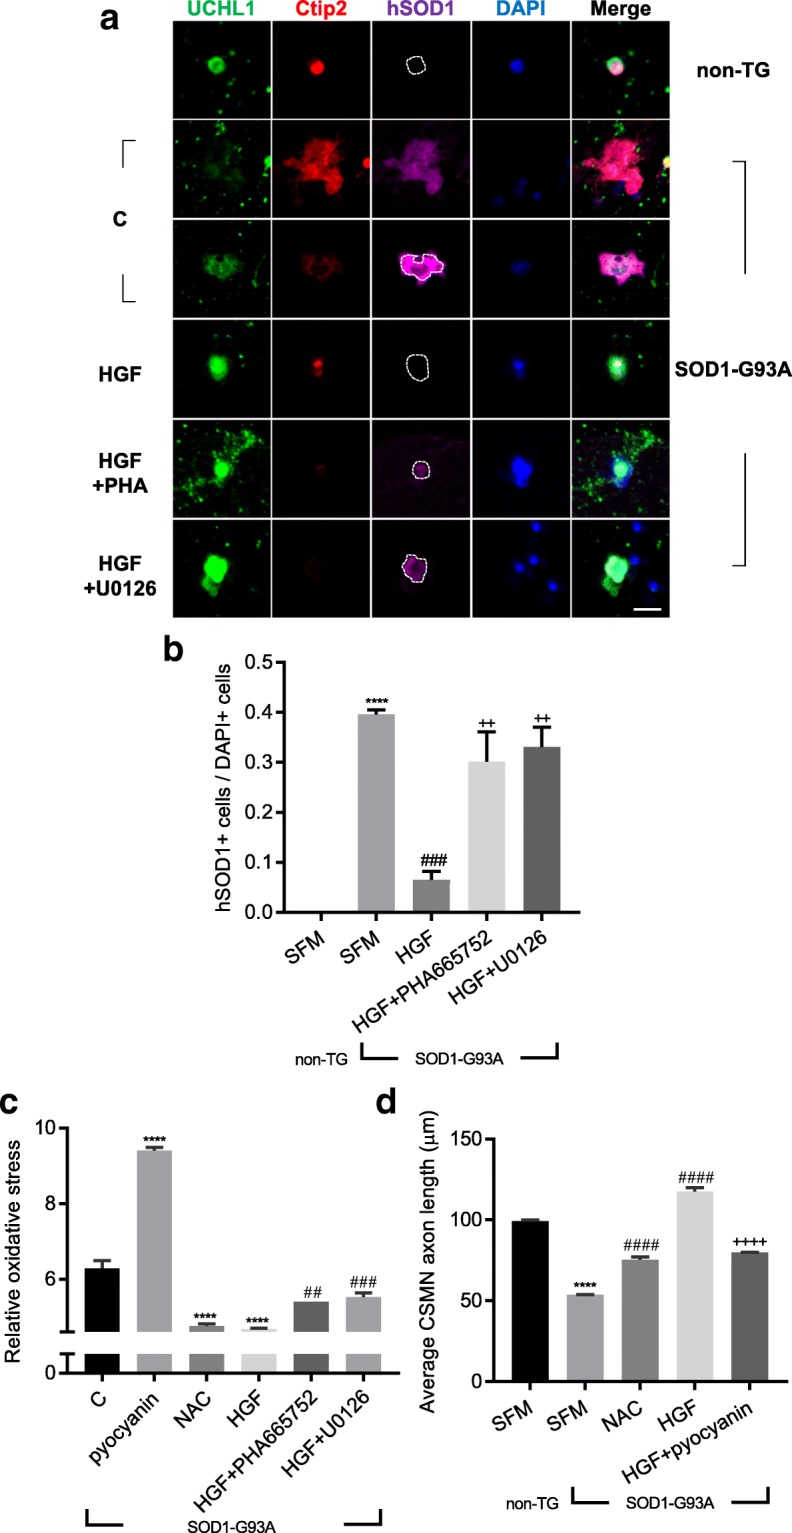
Fig. 8.

Treatment with rHGF reduced levels of protein aggregation and oxidative stress induced by mutant SOD1. a-b ICC assay was performed as described in Fig. 5a. Antibodies specific to UCHL1 and Ctip2 were used to label CSMNs, together with those for hSOD1 (magenta). C: Treated with SFM. In the hSOD1-stained panels, the cell boundaries of the CSMNs were outlined based on the UCHL1 signals, except for the panel in the second row, where the cell boundaries are ambiguous. Proportion of hSOD1-positive cells per DAPI-positive cells was counted and represented as a bar graph (b). For statistical analysis, one-way ANOVA was performed, followed by Tukey’s post hoc test. ****p < 0.0001 for non-TG SFM vs. TG SFM, ###p < 0.001 for TG SFM vs. TG HGF, ++p < 0.01 for TG HGF vs. TG HGF + PHA665752 (or TG HGF + U0126). c 6.4 × 10⁴ cells were seeded on 96-well plates. Cellular ROS levels were measured using a ROS detection kit and represented as a bar graph. Pyocyanin was used as an inducer of ROS, whereas N-acetyl-L-cysteine (NAC) was employed as a scavenger of ROS. For statistical analysis, one-way ANOVA was performed, followed by Tukey’s post-hoc test. ****p < 0.0001 for SFM vs. pyocyanin (or NAC or HGF), ##p < 0.01 for HGF vs. HGF + PHA665752, ###p < 0.001 for HGF vs. HGF + U0126. d The axon length of CSMNs was measured and represented as a bar graph. For bar graphs, values are represented as mean ± SEM. For statistical analysis, one-way ANOVA was performed, followed by Tukey’s post-hoc test. ****p < 0.0001 for non-TG SFM vs. TG SFM, ####p < 0.0001 for TG SFM vs. TG NAC (or TG HGF), ++++p < 0.0001 for TG HGF vs. TG HGF + pyocyanin. Scale bar: a = 20 μm
