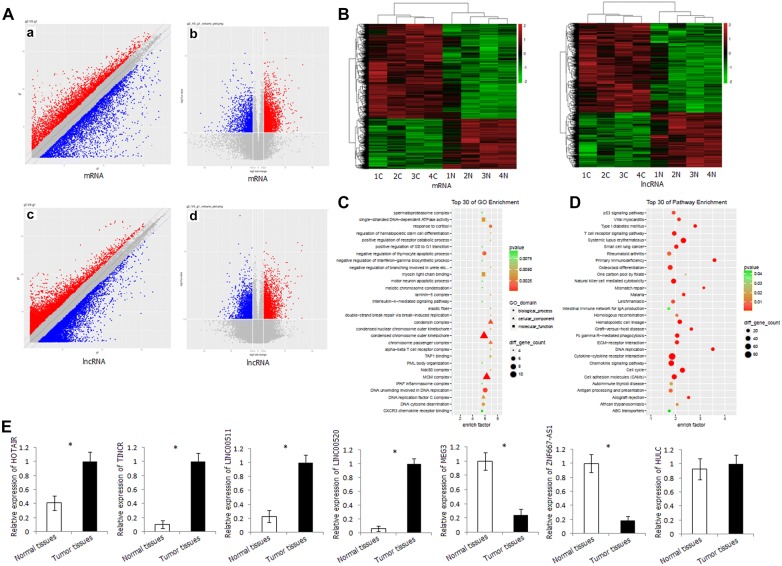
Fig. 1.
Differentially expressed mRNA and lncRNA in metastatic LSCC by microarray array. A Scatter plot and volcano plot of the mRNA and lncRNA distribution in LSCC tissues and corresponding normal tissues. a Scatter plot of mRNA distribution; b volcano plot of mRNA distribution; c scatter plot of lncRNA distribution; d volcano plot of lncRNA distribution. B Heatmap of the mRNA and lncRNA expression in LSCC tissues and corresponding normal tissues. C GO analysis of differentially expressed mRNA. D KEGG pathway analysis of differentially expressed mRNA. E Relative expression level of HOTAIR, TINCR, LINC00511, LINC00520, MEG3, ZNF667-AS1, and HULC in LSCC tissues and corresponding normal tissues detected by qRT-PCR. *P < 0.05

