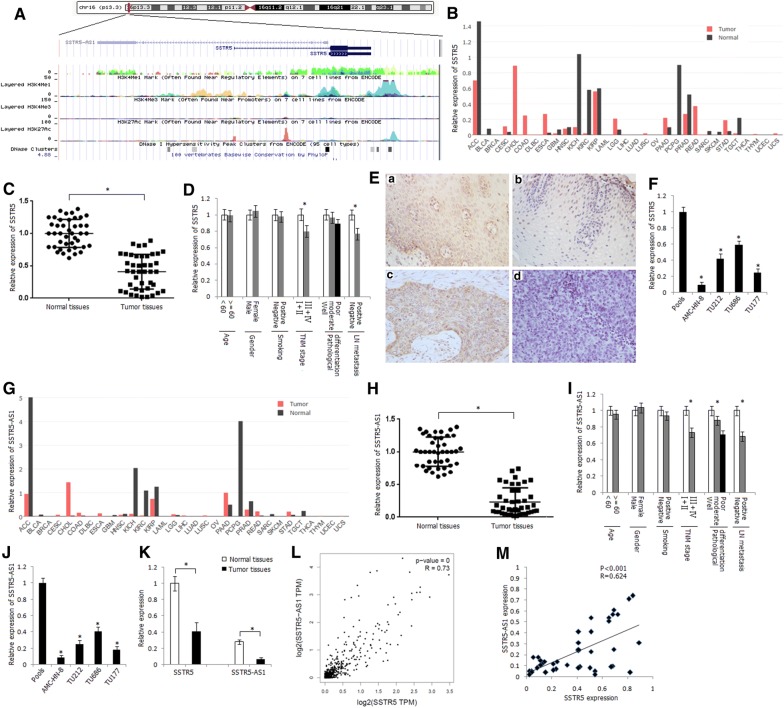
Fig. 2.
Expression status of SSTR5 and SSTR5-AS1 in LSCC tissues and laryngeal carcinoma cell lines. A Schematic representation of the genomic organization and epigenetic marks of SSTR5 and SSTR5-AS1 (data from UCSC Genome Browser). B Relative expression of SSTR5 in various tumor types in GEPIA dataset. ACC adrenocortical carcinoma, BLCA bladder urothelial carcinoma, BRCA breast invasive carcinoma, CESC cervical squamous cell carcinoma and endocervical adenocarcinoma, CHOL cholangio carcinoma, COAD colon adenocarcinoma, DLBC lymphoid neoplasm diffuse large B cell lymphoma, ESCA esophageal carcinoma, GBM glioblastoma multiforme, HNSC head and neck squamous cell carcinoma, KICH kidney chromophobe, KIRC kidney renal clear cell carcinoma, KIRP kidney renal papillary cell carcinoma, LAML acute myeloid leukemia, LGG brain lower grade glioma, LIHC liver hepatocellular carcinoma, LUAD lung adenocarcinoma, LUSC lung squamous cell carcinoma, MESO mesothelioma, OV ovarian serous cystadenocarcinoma, PAAD pancreatic adenocarcinoma, PCPG pheochromocytoma and paraganglioma, PRAD prostate adenocarcinoma, READ rectum adenocarcinoma, SARC sarcoma, SKCM skin cutaneous melanoma, STAD stomach adenocarcinoma, TGCT testicular germ cell tumors, THCA thyroid carcinoma, THYM thymoma, UCEC uterine corpus endometrial carcinoma, UCS uterine carcinosarcoma, UVM uveal melanoma. C Relative expression level of SSTR5 in LSCC tissues and corresponding normal tissues, as determined by qRT-PCR method. *P < 0.05. D Relative expression level of SSTR5 in different subgroups. *P < 0.05. E Immunohistochemical staining of SSTR5 in LSCC tumor tissues and normal tissues (SP × 400). a Positive staining of SSTR5 in normal tissue; b negative staining of SSTR5 in normal tissue; c positive staining of SSTR5 in LSCC tissue; d negative staining of SSTR5 in LSCC tissue. F Relative expression level of SSTR5 in human laryngeal carcinoma cell lines. Pools: average expression in ten normal tissues was used as normal control. *Compared with pools, P < 0.05. G Relative expression level of SSTR5-AS1 in various tumor types in GEPIA dataset. H Relative expression level of SSTR5-AS1 in LSCC tissues and corresponding normal tissues, as determined by qRT-PCR method. *P < 0.05. I. Relative expression level of SSTR5-AS1 in different subgroups. *P < 0.05. J Relative expression level of SSTR5-AS1 in human laryngeal carcinoma cell lines. *Compared with pools, P < 0.05. K Expression comparison of SSTR5 and SSTR5-AS1 in LSCC tissues and corresponding normal tissues. *P < 0.05. L Correlation between the expression of SSTR5 and SSTR5-AS1 in HNSC tissues in GEPIA dataset. M Correlation between the expression of SSTR5 and SSTR5-AS1 in LSCC tissues

