Fig. 3.
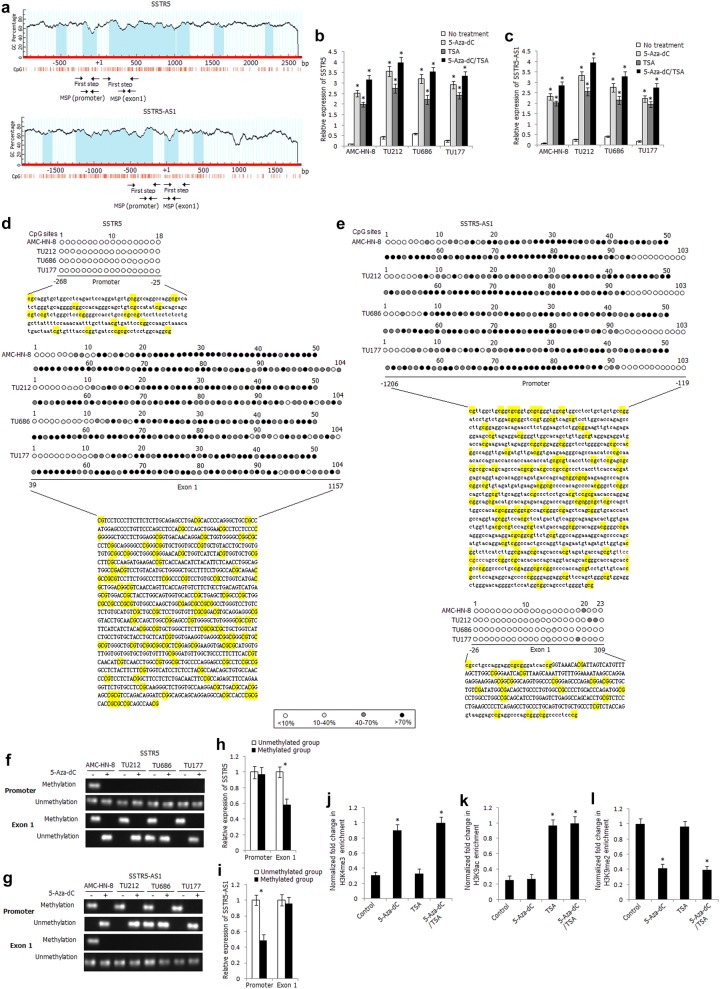
Epigenetic regulation mechanisms of inactivation of SSTR5 and SSTR5-AS1 in LSCC. a Schematic structure of SSTR5 and SSTR5-AS1 CpG islands predicted by MethPrimer. MSP regions analyzed are indicated in the different regions. Relative expression levels of SSTR5 (b) and SSTR5-AS1 (c) in 5-Aza-dC-, TSA-, 5-Aza-dC/TSA-treated laryngeal carcinoma cells. *Compared with untreated cells, P < 0.05. D, E. High-resolution mapping of the methylation status of every CpG site in the promoter and exon 1 regions of SSTR5 (d) and SSTR5-AS1 (e) by BGS assay in four laryngeal carcinoma cells. Each CpG site is shown at the top row as an individual number. Percentage methylation was determined as percentage of methylated cytosines from eight to ten sequenced colonies. The color of circles for each CpG site represents the percentage of methylation. Methylation status of the promoter and exon 1 regions of SSTR5 (f) and SSTR5-AS1 (g) determined by BS-MSP analysis in laryngeal carcinoma cells treated or untreated with 5-Aza-dC. Relative expression levels of SSTR5 (h) and SSTR5-AS1 (i) in the tumor tissues with and without methylation of the promoter and exon 1 regions. *P < 0.05. ChIP assay was used to determine the enrichment of H3K4me3 (j), H3K9ac (k), H3K9me2 (l) within the SSTR5 promoter in AMC-HN-8 cells. *Compared with untreated cells, P < 0.05

