Figure 1.
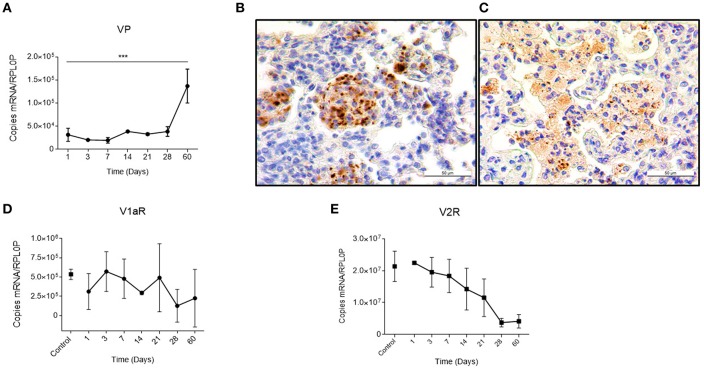
Local kinetics of VP expression and VPR during pulmonary tuberculosis (A) Absolute expression of VP mRNA in lung homogenates during the course of infection. (B) Representative micrographs of immunohistochemistry with anti-VP antibody of the infected lung on day 14 showing immunopositive macrophages forming a granuloma (400×). As well as in foamy macrophages of pneumonic areas on day 60 post-infection (C). (D,E) Absolute quantification of V1a and V2 mRNA, respectively, in lungs of healthy (control) and infected mice. Data are expressed as means ± SD of three different animals at each point. Asterisks represent statistical significance (***P < 0.0001, one-tailed ANOVA).

