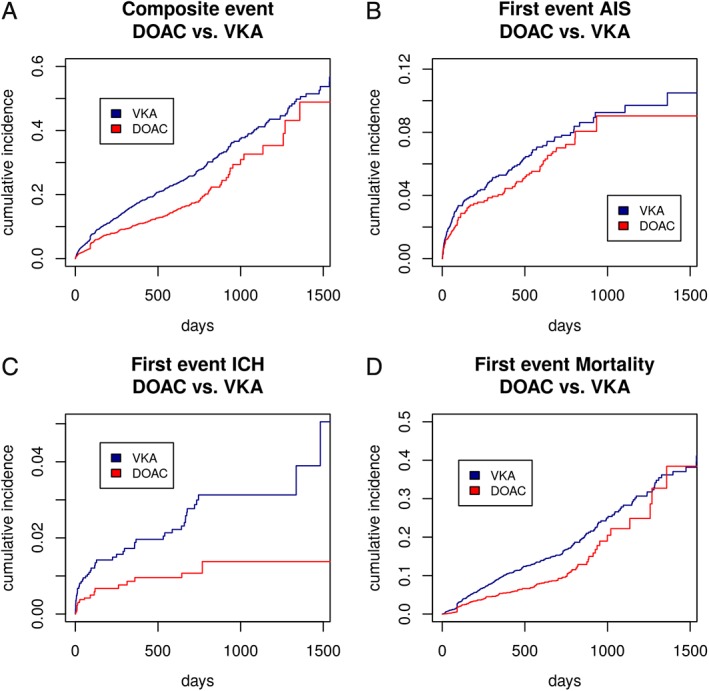
Figure 2.

Kaplan‐Meier curves for the composite endpoint (A), recurrent AIS (B), ICH (C), and mortality (D) for patients in both groups (VKA vs DOAC). AIS = acute ischemic stroke; DOAC = direct oral anticoagulant; ICH = intracranial hemorrhage; VKA = vitamin K antagonist. [Color figure can be viewed at www.annalsofneurology.org]
