Figure 2.

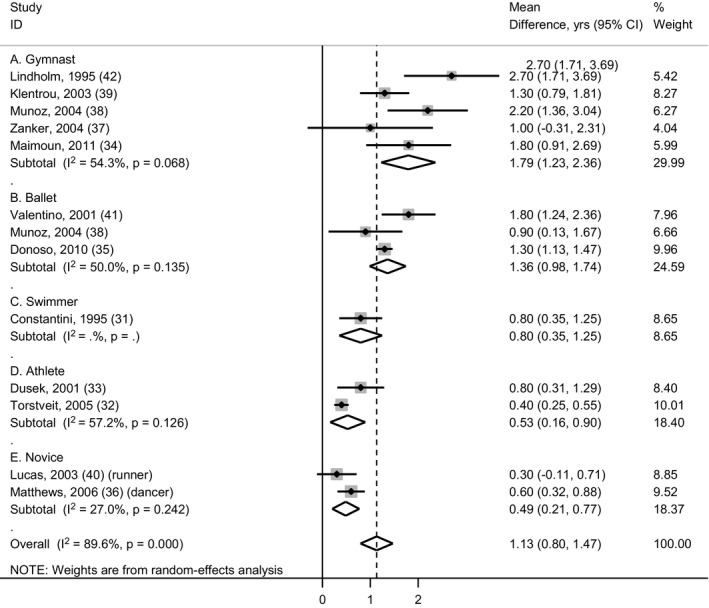
Forest plot showing mean differences in age at menarche (years) in athletes compared to nonathletes, categorised by type of athlete. Data are from inverse‐variance‐weighted random‐effects meta‐analysis.

Forest plot showing mean differences in age at menarche (years) in athletes compared to nonathletes, categorised by type of athlete. Data are from inverse‐variance‐weighted random‐effects meta‐analysis.